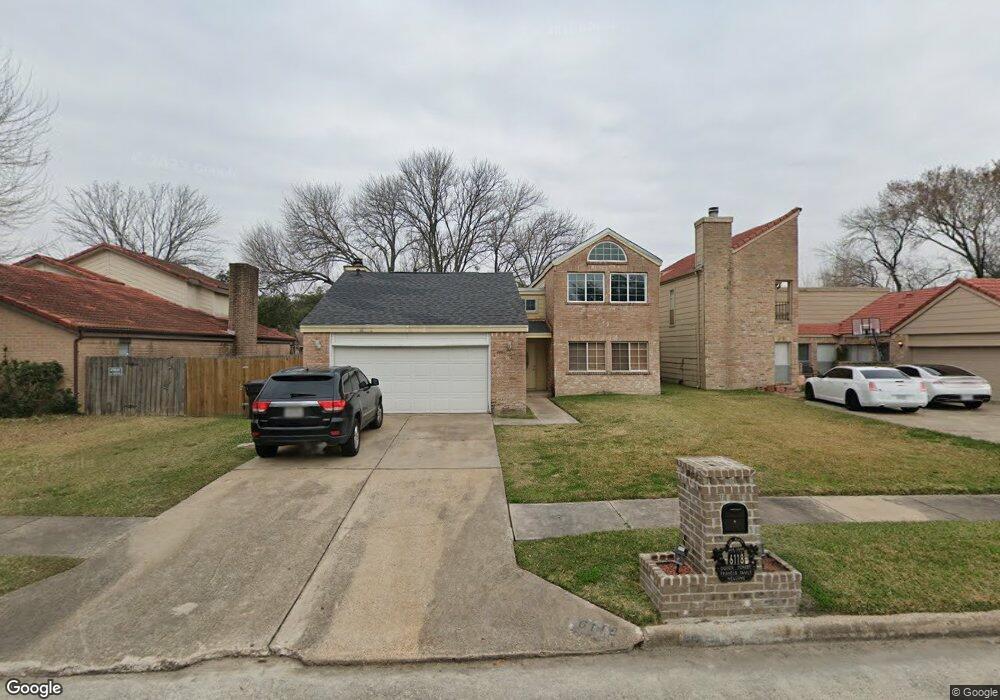
6118 Ogden Forest Dr Houston, TX 77088
Inwood North NeighborhoodEstimated Value: $239,000 - $275,388
3
Beds
2
Baths
2,230
Sq Ft
$116/Sq Ft
Est. Value
About This Home
This home is located at 6118 Ogden Forest Dr, Houston, TX 77088 and is currently estimated at $258,597, approximately $115 per square foot. 6118 Ogden Forest Dr is a home located in Harris County with nearby schools including Nitsch Elementary School, Klein Intermediate School, and Klein Forest High School.
Ownership History
Date
Name
Owned For
Owner Type
Purchase Details
Closed on
Jul 9, 2015
Sold by
Shoulders Luvina and Francis Damon J
Bought by
Francis Damon J
Current Estimated Value
Purchase Details
Closed on
Feb 7, 2004
Sold by
Francis Damon J
Bought by
Francis Damon J and Shoulders Luvenia
Home Financials for this Owner
Home Financials are based on the most recent Mortgage that was taken out on this home.
Original Mortgage
$101,000
Interest Rate
5.86%
Mortgage Type
New Conventional
Purchase Details
Closed on
Jan 2, 1998
Sold by
Coker David Duane and Coker Billie Ann
Bought by
Francis Damon J
Home Financials for this Owner
Home Financials are based on the most recent Mortgage that was taken out on this home.
Original Mortgage
$77,686
Interest Rate
7.13%
Mortgage Type
FHA
Create a Home Valuation Report for This Property
The Home Valuation Report is an in-depth analysis detailing your home's value as well as a comparison with similar homes in the area
Home Values in the Area
Average Home Value in this Area
Purchase History
| Date | Buyer | Sale Price | Title Company |
|---|---|---|---|
| Francis Damon J | -- | None Available | |
| Francis Damon J | -- | Fidelity National Title | |
| Francis Damon J | -- | -- |
Source: Public Records
Mortgage History
| Date | Status | Borrower | Loan Amount |
|---|---|---|---|
| Closed | Francis Damon J | $101,000 | |
| Closed | Francis Damon J | $77,686 |
Source: Public Records
Tax History Compared to Growth
Tax History
| Year | Tax Paid | Tax Assessment Tax Assessment Total Assessment is a certain percentage of the fair market value that is determined by local assessors to be the total taxable value of land and additions on the property. | Land | Improvement |
|---|---|---|---|---|
| 2025 | $4,035 | $230,714 | $57,465 | $173,249 |
| 2024 | $4,035 | $239,672 | $57,465 | $182,207 |
| 2023 | $4,035 | $254,646 | $57,465 | $197,181 |
| 2022 | $4,658 | $232,960 | $38,310 | $194,650 |
| 2021 | $4,465 | $171,353 | $23,944 | $147,409 |
| 2020 | $4,291 | $156,069 | $23,944 | $132,125 |
| 2019 | $3,775 | $133,254 | $15,324 | $117,930 |
| 2018 | $1,906 | $133,254 | $15,324 | $117,930 |
| 2017 | $3,776 | $133,254 | $15,324 | $117,930 |
| 2016 | $3,776 | $133,254 | $15,324 | $117,930 |
| 2015 | $2,371 | $124,945 | $15,324 | $109,621 |
| 2014 | $2,371 | $96,032 | $15,324 | $80,708 |
Source: Public Records
Map
Nearby Homes
- 6111 Ogden Forest Dr
- 6006 Ogden Forest Dr
- 6122 Gallant Forest Dr
- 6114 Elkwood Forest Dr
- 6023 Elkwood Forest Dr
- 8918 Bold Forest Dr
- 5942 Caruso Forest Dr
- 5935 Caruso Forest Dr
- 32 Regency Ln
- 5831 Longforest Dr
- 6222 Downwood Forest Dr
- 6703 Casablanca Dr
- 6630 Inwood Dr W
- 5718 Longforest Dr
- 8810 Enchanted Forest Dr
- 10126 Wild Hollow Ln
- 5638 Fairview Forest Dr
- 7709 Inwood Dr W
- 6011 Green Falls Dr
- 6713 Breen Dr
- 6114 Ogden Forest Dr
- 6122 Ogden Forest Dr
- 6119 Whitter Forest Dr
- 6110 Ogden Forest Dr
- 6123 Whitter Forest Dr
- 6115 Whitter Forest Dr
- 6126 Ogden Forest Dr
- 6127 Whitter Forest Dr
- 6111 Whitter Forest Dr
- 6119 Ogden Forest Dr
- 6123 Ogden Forest Dr
- 6115 Ogden Forest Dr
- 6106 Ogden Forest Dr
- 6202 Ogden Forest Dr
- 6203 Whitter Forest Dr
- 6127 Ogden Forest Dr
- 6107 Whitter Forest Dr
- 6206 Ogden Forest Dr
- 6102 Ogden Forest Dr
- 6203 Ogden Forest Dr