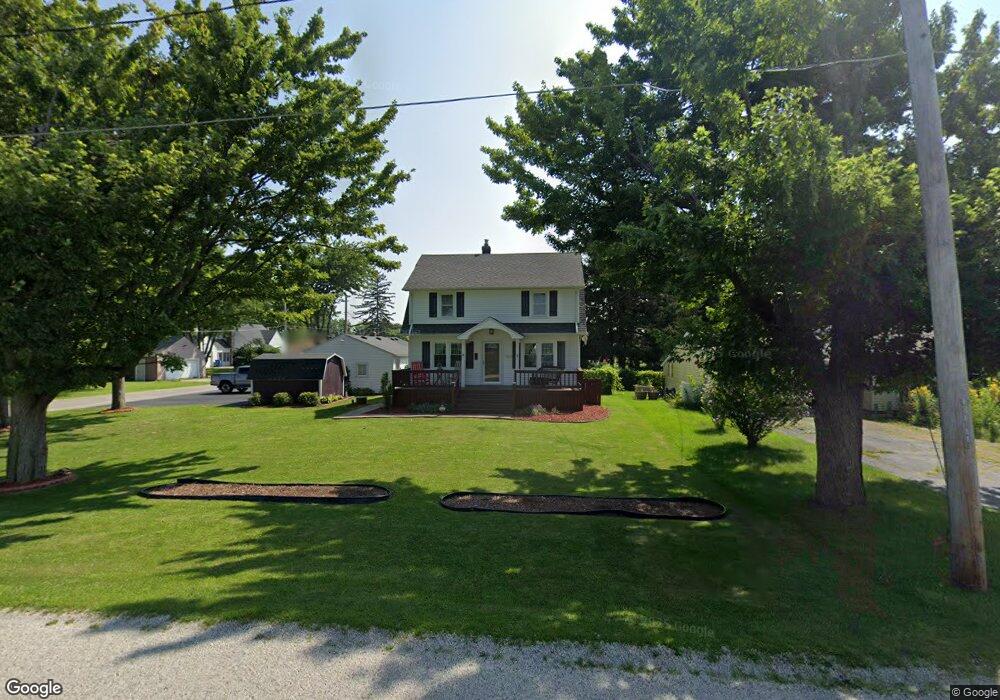
6119 N Martin Williston Rd Williston, OH 43468
Estimated Value: $198,228 - $299,000
3
Beds
2
Baths
1,706
Sq Ft
$138/Sq Ft
Est. Value
About This Home
This home is located at 6119 N Martin Williston Rd, Williston, OH 43468 and is currently estimated at $236,057, approximately $138 per square foot. 6119 N Martin Williston Rd is a home with nearby schools including Genoa Elementary School.
Ownership History
Date
Name
Owned For
Owner Type
Purchase Details
Closed on
Dec 17, 2014
Sold by
Lau Michael P
Bought by
Lau Michael P and Lau Andrea L
Current Estimated Value
Home Financials for this Owner
Home Financials are based on the most recent Mortgage that was taken out on this home.
Original Mortgage
$126,544
Outstanding Balance
$81,443
Interest Rate
3.99%
Mortgage Type
VA
Estimated Equity
$154,614
Purchase Details
Closed on
Nov 21, 2007
Sold by
Johnson Eric D and Johnson Wendy K
Bought by
Lau Michael P
Home Financials for this Owner
Home Financials are based on the most recent Mortgage that was taken out on this home.
Original Mortgage
$140,967
Interest Rate
6.47%
Mortgage Type
VA
Purchase Details
Closed on
Apr 25, 1997
Sold by
Polsdorfer Richard L
Bought by
Johnson Eric D and Reamsnyder Wendy K
Home Financials for this Owner
Home Financials are based on the most recent Mortgage that was taken out on this home.
Original Mortgage
$80,750
Interest Rate
7.92%
Mortgage Type
New Conventional
Create a Home Valuation Report for This Property
The Home Valuation Report is an in-depth analysis detailing your home's value as well as a comparison with similar homes in the area
Home Values in the Area
Average Home Value in this Area
Purchase History
| Date | Buyer | Sale Price | Title Company |
|---|---|---|---|
| Lau Michael P | -- | Louisville Title Agency For | |
| Lau Michael P | $138,000 | Chicago Title Insurance Co | |
| Johnson Eric D | $85,000 | -- |
Source: Public Records
Mortgage History
| Date | Status | Borrower | Loan Amount |
|---|---|---|---|
| Open | Lau Michael P | $126,544 | |
| Closed | Lau Michael P | $140,967 | |
| Previous Owner | Johnson Eric D | $80,750 |
Source: Public Records
Tax History Compared to Growth
Tax History
| Year | Tax Paid | Tax Assessment Tax Assessment Total Assessment is a certain percentage of the fair market value that is determined by local assessors to be the total taxable value of land and additions on the property. | Land | Improvement |
|---|---|---|---|---|
| 2024 | $2,672 | $59,724 | $8,799 | $50,925 |
| 2023 | $2,672 | $52,116 | $4,890 | $47,226 |
| 2022 | $2,642 | $52,116 | $4,890 | $47,226 |
| 2021 | $2,333 | $52,120 | $4,890 | $47,230 |
| 2020 | $2,335 | $49,530 | $4,070 | $45,460 |
| 2019 | $2,320 | $49,530 | $4,070 | $45,460 |
| 2018 | $2,213 | $49,020 | $4,070 | $44,950 |
| 2017 | $2,116 | $44,310 | $4,070 | $40,240 |
| 2016 | $2,129 | $44,310 | $4,070 | $40,240 |
| 2015 | $2,120 | $43,850 | $4,070 | $39,780 |
| 2014 | $1,037 | $46,390 | $4,070 | $42,320 |
| 2013 | $1,040 | $46,390 | $4,070 | $42,320 |
Source: Public Records
Map
Nearby Homes
- 21224 W Toledo St
- 0 W Walbridge Rd
- Track 1 W Walbridge Rd
- 19367 W Walbridge Rd
- 6927 N Wildacre Rd
- 7330 Jerusalem Rd
- 445 S Yondota Rd
- 7105 N Elliston Trowbridge Rd
- 9015 Seaman Rd
- 24181 W James Ridge Rd
- 725 Donovan Rd
- 6645 Seaman Rd
- 1861 N Opfer-Lentz Rd
- 5401 Pickle Rd
- 1031 N Cousino Rd
- 5300 Williston Rd
- 23105 W Edgefield Dr
- 6530 Corduroy Rd
- 23225 Ohio 51
- 23430 State Route 51 W
- 20970 Yale St
- 6195 N Martin Williston Rd
- 6195 N Martin Williston Rd
- 20910 Yale St
- 6195 N Martin Williston Rd
- 6229 N Martin Williston Rd
- 20961 Yale St
- 20952 Yale St
- 6181 N Martin Williston Rd
- 6247 N Martin Williston Rd
- 20944 Yale St
- 20937 Yale St
- 6250 N Martin Williston Rd
- 20951 W Thorpe St
- 20911 Yale St
- 6161 N Martin Williston Rd
- 6259 N Martin Williston Rd
- 6161 N Martin Williston Rd
- 20897 Yale St
- 20944 Yale St