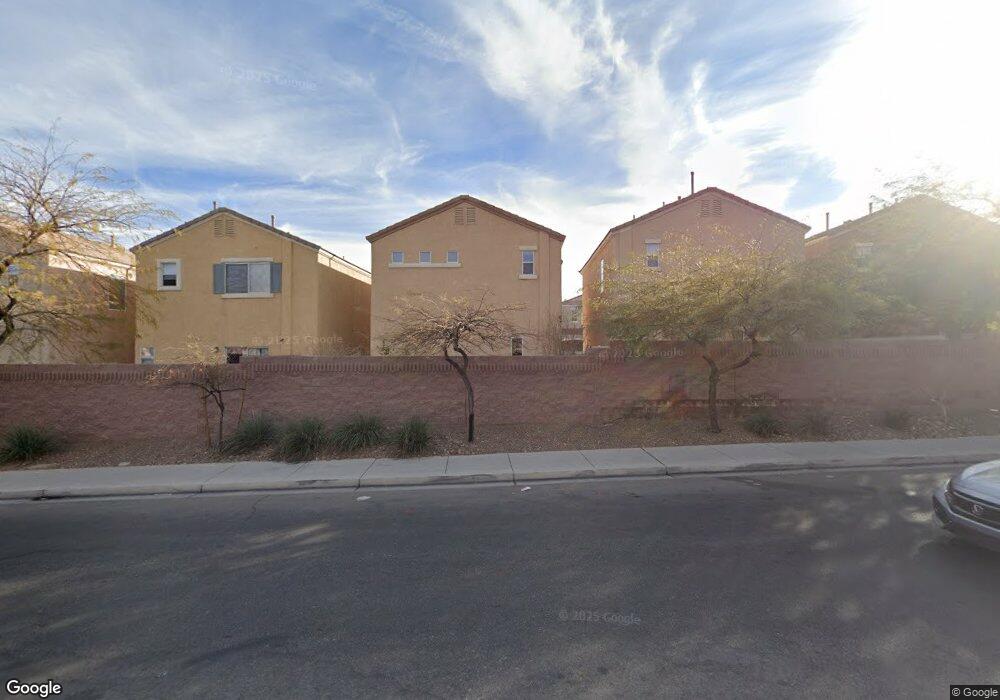
6119 Squilchuck Ct Las Vegas, NV 89139
Coronado Ranch NeighborhoodEstimated Value: $344,000 - $363,383
2
Beds
3
Baths
1,405
Sq Ft
$253/Sq Ft
Est. Value
About This Home
This home is located at 6119 Squilchuck Ct, Las Vegas, NV 89139 and is currently estimated at $354,846, approximately $252 per square foot. 6119 Squilchuck Ct is a home located in Clark County with nearby schools including Lawrence & Heidi Canarelli Middle School, Sierra Vista High School, and Doral Academy West Pebble.
Ownership History
Date
Name
Owned For
Owner Type
Purchase Details
Closed on
Jun 15, 2022
Sold by
Franky Luo
Bought by
Ho Winny
Current Estimated Value
Purchase Details
Closed on
Apr 22, 2010
Sold by
He Culwel
Bought by
Luo Franky
Home Financials for this Owner
Home Financials are based on the most recent Mortgage that was taken out on this home.
Original Mortgage
$76,000
Interest Rate
4.92%
Mortgage Type
New Conventional
Purchase Details
Closed on
Feb 24, 2010
Sold by
Wang Jun
Bought by
Luo Franky
Home Financials for this Owner
Home Financials are based on the most recent Mortgage that was taken out on this home.
Original Mortgage
$76,000
Interest Rate
4.92%
Mortgage Type
New Conventional
Purchase Details
Closed on
Apr 26, 2006
Sold by
Richmond American Homes Of Nevada Inc
Bought by
Wang Jun
Home Financials for this Owner
Home Financials are based on the most recent Mortgage that was taken out on this home.
Original Mortgage
$231,990
Interest Rate
6.29%
Mortgage Type
Fannie Mae Freddie Mac
Create a Home Valuation Report for This Property
The Home Valuation Report is an in-depth analysis detailing your home's value as well as a comparison with similar homes in the area
Home Values in the Area
Average Home Value in this Area
Purchase History
| Date | Buyer | Sale Price | Title Company |
|---|---|---|---|
| Ho Winny | -- | None Listed On Document | |
| Luo Franky | -- | Old Republic Title Company | |
| Luo Franky | $95,000 | Old Republic Title Company | |
| Wang Jun | $289,990 | Ticor Title Of Nevada Inc |
Source: Public Records
Mortgage History
| Date | Status | Borrower | Loan Amount |
|---|---|---|---|
| Previous Owner | Luo Franky | $76,000 | |
| Previous Owner | Wang Jun | $231,990 |
Source: Public Records
Tax History Compared to Growth
Tax History
| Year | Tax Paid | Tax Assessment Tax Assessment Total Assessment is a certain percentage of the fair market value that is determined by local assessors to be the total taxable value of land and additions on the property. | Land | Improvement |
|---|---|---|---|---|
| 2025 | $1,155 | $88,686 | $29,750 | $58,936 |
| 2024 | $1,122 | $88,686 | $29,750 | $58,936 |
| 2023 | $1,122 | $82,545 | $26,950 | $55,595 |
| 2022 | $1,089 | $74,188 | $23,450 | $50,738 |
| 2021 | $1,057 | $69,563 | $21,350 | $48,213 |
| 2020 | $1,024 | $69,103 | $21,350 | $47,753 |
| 2019 | $994 | $64,821 | $17,850 | $46,971 |
| 2018 | $965 | $57,876 | $12,950 | $44,926 |
| 2017 | $1,692 | $57,695 | $12,250 | $45,445 |
| 2016 | $915 | $49,705 | $8,750 | $40,955 |
| 2015 | $912 | $45,137 | $8,050 | $37,087 |
| 2014 | $885 | $29,284 | $4,200 | $25,084 |
Source: Public Records
Map
Nearby Homes
- 7553 Rustic Galleon St
- 6111 Walker Valley Ct
- 7463 Grizzly Giant St
- 7451 Grizzly Giant St
- 7658 Sandhaven St
- 7665 Sandhaven St
- 6263 Oread Ave
- 7688 Sandhaven St
- 7478 Coastal Ledge St
- 6315 Anticline Ave Unit 1
- 6016 Sombria Ridge Ave
- 7638 Hope Valley St
- 7435 Silurian St
- 6283 Lapilli Ave
- 6303 Scree Ct
- 6338 Sycamore Grove Ct
- 7552 Wentworth Springs Ct
- 6378 Bright Nimbus Ave
- 7293 Puffer Lake Ct
- 7468 Treasure Chest St
- 6125 Squilchuck Ct
- 6113 Squilchuck Ct
- 6107 Squilchuck Ct
- 6131 Squilchuck Ct
- 6120 Crow Butte Ct
- 6114 Crow Butte Ct
- 6108 Crow Butte Ct
- 6132 Crow Butte Ct
- 6118 Squilchuck Ct
- 6124 Squilchuck Ct
- 6112 Squilchuck Ct
- 6130 Squilchuck Ct
- 6130 Squilchuck Ct
- 6106 Squilchuck Ct
- 7519 Redwood Point St
- 7525 Redwood Point St
- 7515 Redwood Point St
- 7531 Redwood Point St
- 7531 Redwood Point St Unit n/a
- 7531 Redwood Point St Unit none