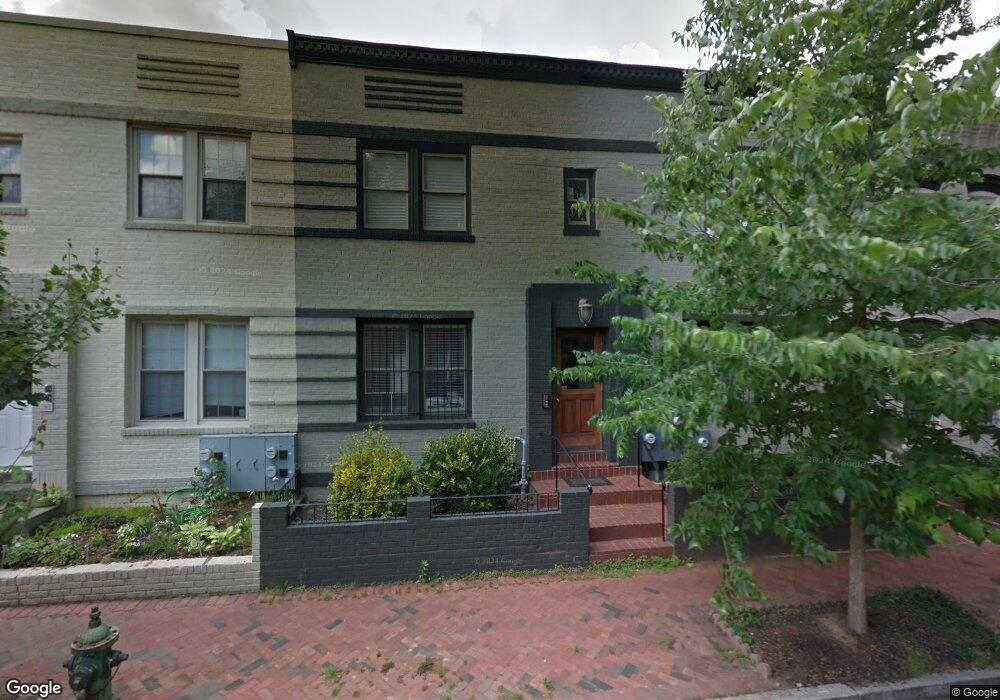
612 14th Place NE Washington, DC 20002
Atlas District NeighborhoodEstimated Value: $339,000 - $371,000
1
Bed
1
Bath
532
Sq Ft
$654/Sq Ft
Est. Value
About This Home
This home is located at 612 14th Place NE, Washington, DC 20002 and is currently estimated at $347,922, approximately $653 per square foot. 612 14th Place NE is a home located in District of Columbia with nearby schools including Miner Elementary School, Eliot-Hine Middle School, and Eastern High School.
Ownership History
Date
Name
Owned For
Owner Type
Purchase Details
Closed on
Jun 13, 2019
Sold by
Roe Shannon
Bought by
Franklin Kristin
Current Estimated Value
Home Financials for this Owner
Home Financials are based on the most recent Mortgage that was taken out on this home.
Original Mortgage
$295,500
Outstanding Balance
$259,277
Interest Rate
4.1%
Mortgage Type
New Conventional
Estimated Equity
$88,645
Purchase Details
Closed on
Aug 6, 2013
Sold by
Fierst Pamela
Bought by
Roe Shannon
Home Financials for this Owner
Home Financials are based on the most recent Mortgage that was taken out on this home.
Original Mortgage
$222,400
Interest Rate
4.45%
Mortgage Type
New Conventional
Purchase Details
Closed on
Sep 1, 2009
Sold by
Citimortgage Inc
Bought by
Fierst Pamela
Purchase Details
Closed on
Sep 12, 2006
Sold by
Ruffin Fletcher
Bought by
Mercer Morris M
Create a Home Valuation Report for This Property
The Home Valuation Report is an in-depth analysis detailing your home's value as well as a comparison with similar homes in the area
Home Values in the Area
Average Home Value in this Area
Purchase History
| Date | Buyer | Sale Price | Title Company |
|---|---|---|---|
| Franklin Kristin | $327,500 | Kvs Title Llc | |
| Franklin Kristin | $327,500 | Kvs Title Llc | |
| Roe Shannon | $278,000 | -- | |
| Roe Shannon | $278,000 | -- | |
| Fierst Pamela | $154,900 | -- | |
| Fierst Pamela | $154,900 | -- | |
| Mercer Morris M | $319,000 | -- | |
| Mercer Morris M | $319,000 | -- |
Source: Public Records
Mortgage History
| Date | Status | Borrower | Loan Amount |
|---|---|---|---|
| Open | Franklin Kristin | $295,500 | |
| Previous Owner | Roe Shannon | $222,400 |
Source: Public Records
Tax History Compared to Growth
Tax History
| Year | Tax Paid | Tax Assessment Tax Assessment Total Assessment is a certain percentage of the fair market value that is determined by local assessors to be the total taxable value of land and additions on the property. | Land | Improvement |
|---|---|---|---|---|
| 2025 | $2,211 | $365,650 | $109,690 | $255,960 |
| 2024 | $2,277 | $370,070 | $111,020 | $259,050 |
| 2023 | $2,225 | $360,460 | $108,140 | $252,320 |
| 2022 | $2,354 | $369,350 | $110,800 | $258,550 |
| 2021 | $2,189 | $347,190 | $104,160 | $243,030 |
| 2020 | $2,531 | $373,440 | $112,030 | $261,410 |
| 2019 | $2,171 | $355,810 | $106,740 | $249,070 |
| 2018 | $1,985 | $334,830 | $0 | $0 |
| 2017 | $1,811 | $322,600 | $0 | $0 |
| 2016 | $1,653 | $296,450 | $0 | $0 |
| 2015 | $1,505 | $251,830 | $0 | $0 |
| 2014 | -- | $232,320 | $0 | $0 |
Source: Public Records
Map
Nearby Homes
- 623 14th Place NE Unit D
- 613 14th Place NE
- 1409 G St NE Unit 4
- 1409 G St NE Unit 5
- 1375 Maryland Ave NE Unit F
- 1417 Maryland Ave NE
- 615 15th St NE Unit 1
- 711 15th St NE Unit 4
- 1350 Maryland Ave NE Unit 315
- 1508 F St NE Unit 1
- 1328 Maryland Ave NE Unit 2
- 1328 Maryland Ave NE Unit 3
- 1418 E St NE
- 1524 Gales St NE
- 1526 Gales St NE
- 1528 Gales St NE
- 1363 H St NE
- 706 16th St NE Unit 1
- 1341 H St NE Unit 3B
- 1341 H St NE Unit 4A
- 612 14th Place NE
- 612 14th Place NE
- 612 14th Place NE
- 612 14th Place NE Unit 1
- 612 14th Place NE Unit 4
- 612 14th Place NE Unit 3
- 612 14th Place NE Unit 2
- 614 14th Place NE
- 610 14th Place NE
- 610 14th Place NE
- 610 14th Place NE
- 610 14th Place NE
- 610 14th Place NE
- 610 14th Place NE Unit 4
- 610 14th Place NE Unit 1
- 610 14th Place NE Unit 3
- 610 14th Place NE Unit 2
- 618 14th Place NE
- 608 14th Place NE
- 608 14th Place NE