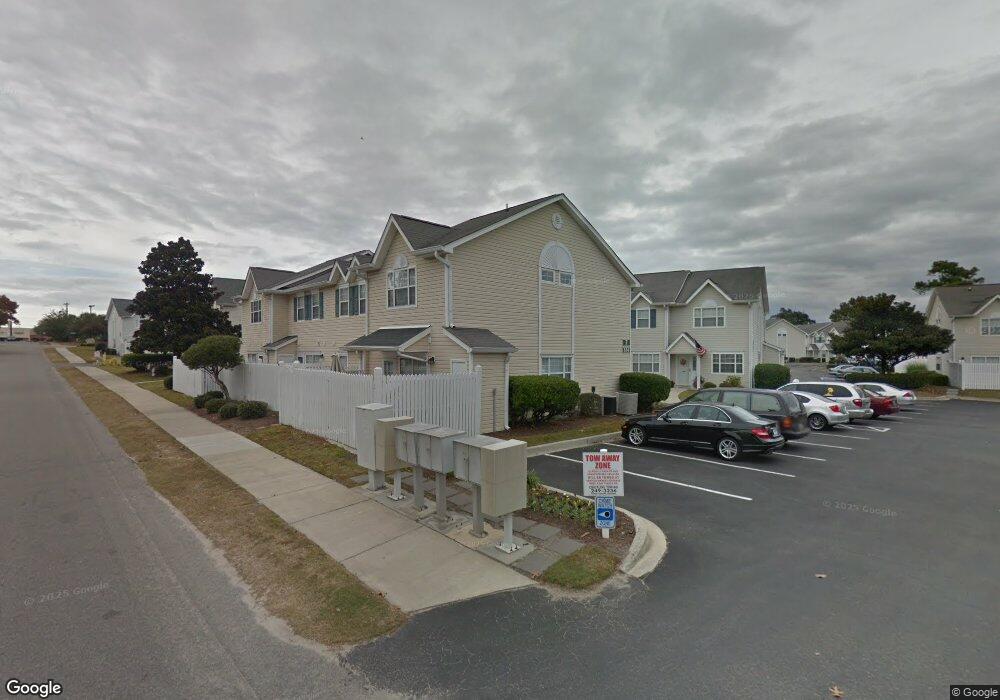
612 3rd Ave S Unit 13-C Sea Gardens Con North Myrtle Beach, SC 29582
Ocean Drive NeighborhoodEstimated Value: $250,000 - $286,000
2
Beds
3
Baths
1,120
Sq Ft
$235/Sq Ft
Est. Value
About This Home
This home is located at 612 3rd Ave S Unit 13-C Sea Gardens Con, North Myrtle Beach, SC 29582 and is currently estimated at $263,498, approximately $235 per square foot. 612 3rd Ave S Unit 13-C Sea Gardens Con is a home located in Horry County with nearby schools including Ocean Drive Elementary School, North Myrtle Beach Middle School, and North Myrtle Beach High School.
Ownership History
Date
Name
Owned For
Owner Type
Purchase Details
Closed on
Jul 13, 2022
Sold by
Tripp Lisa Melinda
Bought by
Gilsdorf Donna
Current Estimated Value
Purchase Details
Closed on
Aug 16, 2004
Sold by
Kaufman Karen
Bought by
Tripp Lisa Melinda
Home Financials for this Owner
Home Financials are based on the most recent Mortgage that was taken out on this home.
Original Mortgage
$95,000
Interest Rate
5.97%
Mortgage Type
Purchase Money Mortgage
Purchase Details
Closed on
Jul 26, 2002
Sold by
Barbato Goldie M
Bought by
Kaufman Karen
Home Financials for this Owner
Home Financials are based on the most recent Mortgage that was taken out on this home.
Original Mortgage
$71,900
Interest Rate
6.53%
Mortgage Type
Purchase Money Mortgage
Create a Home Valuation Report for This Property
The Home Valuation Report is an in-depth analysis detailing your home's value as well as a comparison with similar homes in the area
Home Values in the Area
Average Home Value in this Area
Purchase History
| Date | Buyer | Sale Price | Title Company |
|---|---|---|---|
| Gilsdorf Donna | $279,900 | -- | |
| Tripp Lisa Melinda | $100,000 | -- | |
| Kaufman Karen | $89,900 | -- |
Source: Public Records
Mortgage History
| Date | Status | Borrower | Loan Amount |
|---|---|---|---|
| Previous Owner | Tripp Lisa Melinda | $95,000 | |
| Previous Owner | Kaufman Karen | $71,900 |
Source: Public Records
Tax History Compared to Growth
Tax History
| Year | Tax Paid | Tax Assessment Tax Assessment Total Assessment is a certain percentage of the fair market value that is determined by local assessors to be the total taxable value of land and additions on the property. | Land | Improvement |
|---|---|---|---|---|
| 2024 | $1,200 | $16,800 | $0 | $16,800 |
| 2023 | $1,200 | $13,230 | $0 | $13,230 |
| 2021 | $545 | $13,230 | $0 | $13,230 |
| 2020 | $533 | $13,230 | $0 | $13,230 |
| 2019 | $493 | $13,230 | $0 | $13,230 |
| 2018 | $0 | $12,075 | $0 | $12,075 |
| 2017 | $455 | $12,075 | $0 | $12,075 |
| 2016 | -- | $12,075 | $0 | $12,075 |
| 2015 | $1,481 | $4,600 | $0 | $4,600 |
| 2014 | $1,434 | $4,600 | $0 | $4,600 |
Source: Public Records
Map
Nearby Homes
- 613 2nd Ave S Unit 23B
- 618 3rd Ave S Unit 3A
- 609B 3rd Ave S
- 707 1st Ave S Unit 36A
- 94 Cedar Ave
- 522 6th Ave S
- 516 6th Ave S
- 606 7th Ave S Unit F
- 607 Rosemary Ln
- 100 Ye Olde Kings Hwy Unit H
- 100 Ye Olde Kings Hwy Unit E
- 519 7th Ave S
- 629 Surfsong Way Unit B8-4
- 611 Surfsong Way Unit B6-3
- 623 Rosemary Ln
- 620 Wave Rider Ln Unit B10-1
- 80 Princess Dr
- 104 Ash St
- 410 5th Ave S
- 756 Shell Creek Cir Unit 756
- 612 3rd Ave S Unit 8C
- 612 3rd Ave S Unit 8-B SEA GARDEN
- 612 3rd Ave S Unit 11-C Sea Garden
- 612 3rd Ave S Unit Sea Garden 11-B
- 612 3rd Ave S
- 612 3rd Ave S Unit 5C
- 612 3rd Ave S Unit 5B
- 612 3rd Ave S Unit 5A
- 612 3rd Ave S Unit 7D
- 612 3rd Ave S Unit 7C
- 612 3rd Ave S Unit 7B
- 612 3rd Ave S Unit 7A
- 612 3rd Ave S Unit 6E
- 612 3rd Ave S Unit 6D
- 612 3rd Ave S Unit 6C
- 612 3rd Ave S Unit 6B
- 612 3rd Ave S Unit 6A
- 612 3rd Ave S Unit 14C
- 612 3rd Ave S Unit 12D
- 612 3rd Ave S Unit 12B