Estimated Value: $246,877 - $273,000
3
Beds
2
Baths
1,634
Sq Ft
$159/Sq Ft
Est. Value
About This Home
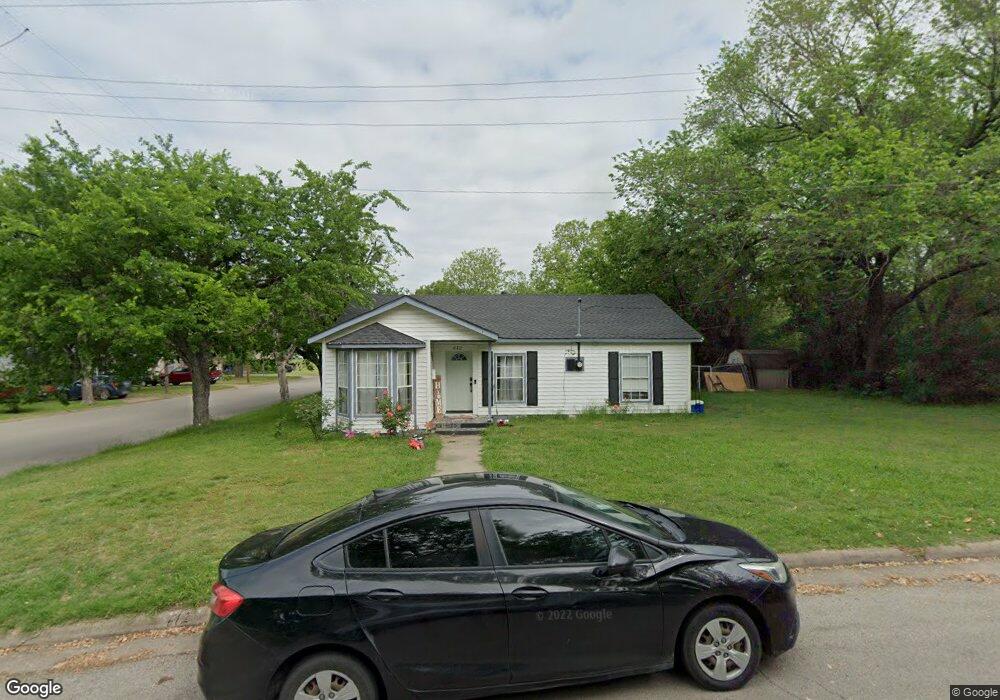
This home is located at 612 Alexander St, Ennis, TX 75119 and is currently estimated at $259,939, approximately $159 per square foot. 612 Alexander St is a home located in Ellis County with nearby schools including Austin Elementary School, Dorie Miller Int, and Ennis Junior High School.
Ownership History
Date
Name
Owned For
Owner Type
Purchase Details
Closed on
Oct 9, 2017
Sold by
Pbrei Llc
Bought by
Tri Omega Property Investors Llc
Current Estimated Value
Home Financials for this Owner
Home Financials are based on the most recent Mortgage that was taken out on this home.
Original Mortgage
$115,000
Outstanding Balance
$96,057
Interest Rate
3.82%
Mortgage Type
Construction
Estimated Equity
$163,882
Purchase Details
Closed on
Sep 7, 2017
Sold by
Garcia Justin
Bought by
Pbrei Llc
Home Financials for this Owner
Home Financials are based on the most recent Mortgage that was taken out on this home.
Original Mortgage
$115,000
Outstanding Balance
$96,057
Interest Rate
3.82%
Mortgage Type
Construction
Estimated Equity
$163,882
Purchase Details
Closed on
Mar 22, 2017
Sold by
Shepperd Jim Leland
Bought by
Garcia Justin
Home Financials for this Owner
Home Financials are based on the most recent Mortgage that was taken out on this home.
Original Mortgage
$105,000
Interest Rate
4.17%
Mortgage Type
Purchase Money Mortgage
Create a Home Valuation Report for This Property
The Home Valuation Report is an in-depth analysis detailing your home's value as well as a comparison with similar homes in the area
Home Values in the Area
Average Home Value in this Area
Purchase History
| Date | Buyer | Sale Price | Title Company |
|---|---|---|---|
| Tri Omega Property Investors Llc | -- | None Available | |
| Pbrei Llc | -- | None Available | |
| Garcia Justin | -- | None Available |
Source: Public Records
Mortgage History
| Date | Status | Borrower | Loan Amount |
|---|---|---|---|
| Open | Tri Omega Property Investors Llc | $115,000 | |
| Previous Owner | Garcia Justin | $105,000 |
Source: Public Records
Tax History Compared to Growth
Tax History
| Year | Tax Paid | Tax Assessment Tax Assessment Total Assessment is a certain percentage of the fair market value that is determined by local assessors to be the total taxable value of land and additions on the property. | Land | Improvement |
|---|---|---|---|---|
| 2025 | $3,902 | $239,924 | $71,500 | $168,424 |
| 2024 | $3,902 | $239,858 | -- | -- |
| 2023 | $3,902 | $218,053 | $0 | $0 |
| 2022 | $4,744 | $198,230 | $36,300 | $161,930 |
| 2021 | $3,992 | $158,560 | $28,880 | $129,680 |
| 2020 | $4,013 | $155,950 | $22,500 | $133,450 |
| 2019 | $3,520 | $134,320 | $0 | $0 |
| 2018 | $3,207 | $121,540 | $12,500 | $109,040 |
| 2017 | $1,434 | $54,060 | $12,500 | $41,560 |
| 2016 | $1,382 | $52,110 | $12,500 | $39,610 |
| 2015 | $1,340 | $50,480 | $12,500 | $37,980 |
| 2014 | $1,340 | $50,600 | $0 | $0 |
Source: Public Records
Map
Nearby Homes
- 805 Loy Ln
- 3712 Kings Dr
- 1509 Lyndale Dr
- 536 Lakeshore Dr
- 507 Lakeshore Dr
- 1106 N Mckinney St
- 1103 Sunset Dr
- 811 N Gaines St
- 206 Houston St
- 802 N Sherman St
- 800 N Sherman St
- 801 N Mckinney St
- 1206 N Kaufman St
- 603 N Mckinney St
- 1311 Daffan Ave
- 607 N Dallas St
- 2410 Linda Dr
- 606 N Dallas St
- 1308 Daffan Ave
- 905 Royse Ridge Rd
- 608 Alexander St
- 1710 N Clay St
- 613 Park St
- 611 Alexander St
- 1705 N Clay St
- 1703 N Clay St
- 1707 N Clay St
- 609 Alexander St
- 1701 N Clay St
- 1709 N Clay St
- 611 Park St
- 607 Alexander St
- 1607 N Clay St
- 606 Alexander St
- 1711 N Clay St
- 1600 Nichols St
- 1602 Nichols St
- 607 Park St
- 605 Alexander St
- 1605 N Clay St