Estimated Value: $877,341 - $952,000
3
Beds
2
Baths
1,600
Sq Ft
$574/Sq Ft
Est. Value
About This Home
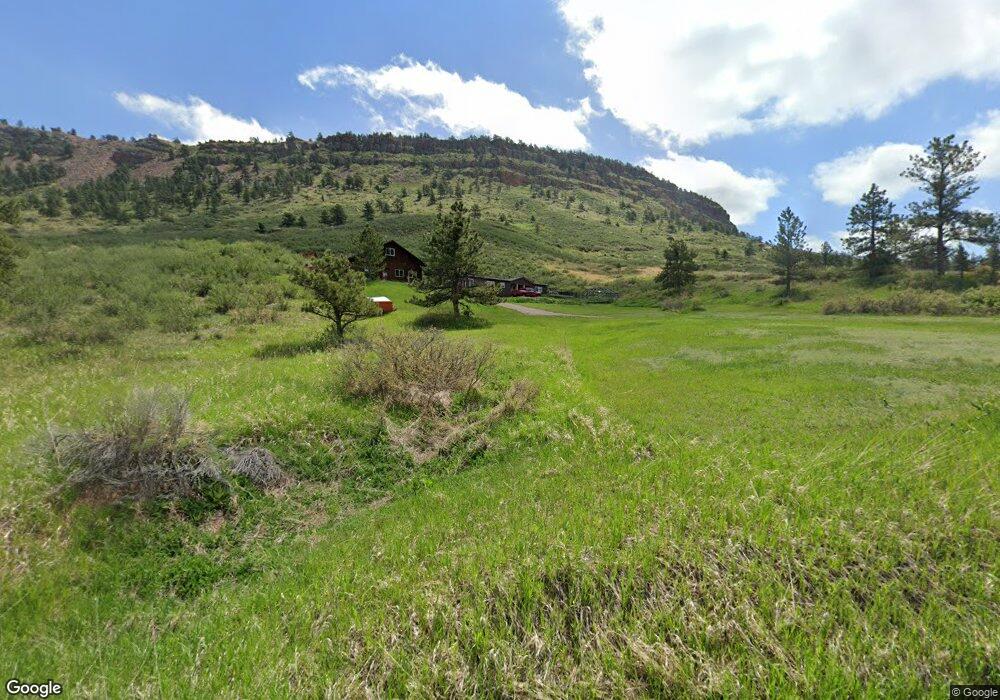
This home is located at 612 Blue Mountain Rd, Lyons, CO 80540 and is currently estimated at $918,447, approximately $574 per square foot. 612 Blue Mountain Rd is a home with nearby schools including Lyons Elementary School and Lyons Middle/Senior High School.
Ownership History
Date
Name
Owned For
Owner Type
Purchase Details
Closed on
Sep 23, 2024
Sold by
Stringham Diane D and Johnson Diane
Bought by
Stringham Revocable Living Trust
Current Estimated Value
Purchase Details
Closed on
Jun 19, 2014
Sold by
Johnson Diane and Estate Of Donald Johnson
Bought by
Johnson Diane
Purchase Details
Closed on
Jul 10, 1998
Sold by
Emerson Peter H and Emerson Sherrie B
Bought by
Johnson Donald A
Home Financials for this Owner
Home Financials are based on the most recent Mortgage that was taken out on this home.
Original Mortgage
$204,000
Interest Rate
10.45%
Purchase Details
Closed on
Aug 1, 1997
Sold by
Emerson Peter H and Emerson Sherrie B
Bought by
Emerson Peter H
Purchase Details
Closed on
May 24, 1991
Bought by
Johnson Diane D
Purchase Details
Closed on
Jan 21, 1988
Bought by
Johnson Diane D
Create a Home Valuation Report for This Property
The Home Valuation Report is an in-depth analysis detailing your home's value as well as a comparison with similar homes in the area
Purchase History
| Date | Buyer | Sale Price | Title Company |
|---|---|---|---|
| Stringham Revocable Living Trust | -- | None Listed On Document | |
| Johnson Diane | -- | None Available | |
| Johnson Donald A | -- | -- | |
| Emerson Peter H | -- | -- | |
| Johnson Diane D | -- | -- | |
| Johnson Diane D | $94,000 | -- |
Source: Public Records
Mortgage History
| Date | Status | Borrower | Loan Amount |
|---|---|---|---|
| Previous Owner | Johnson Donald A | $204,000 |
Source: Public Records
Tax History
| Year | Tax Paid | Tax Assessment Tax Assessment Total Assessment is a certain percentage of the fair market value that is determined by local assessors to be the total taxable value of land and additions on the property. | Land | Improvement |
|---|---|---|---|---|
| 2025 | $5,394 | $52,719 | $39,513 | $13,206 |
| 2024 | $5,309 | $52,474 | $32,273 | $20,201 |
| 2023 | $5,309 | $52,474 | $35,959 | $20,201 |
| 2022 | $3,764 | $36,071 | $11,051 | $25,020 |
| 2021 | $3,734 | $37,109 | $11,369 | $25,740 |
| 2020 | $3,479 | $34,535 | $11,369 | $23,166 |
| 2019 | $3,427 | $34,535 | $11,369 | $23,166 |
| 2018 | $2,952 | $29,822 | $11,520 | $18,302 |
| 2017 | $2,904 | $32,970 | $12,736 | $20,234 |
| 2016 | $2,713 | $27,326 | $15,283 | $12,043 |
| 2015 | $2,557 | $24,278 | $13,930 | $10,348 |
| 2014 | $2,111 | $24,278 | $13,930 | $10,348 |
Source: Public Records
Map
Nearby Homes
- 1312 Steamboat Valley Rd
- 1669 Apple Valley Rd
- 101 Lewis Ln
- 180 Valley View Ln
- 119 Eagle Canyon Cir
- 1285 Eagle Ridge Rd
- 458 Longmont Dam Rd
- 2685 Eagle Ridge Rd
- 1570 County Road 37e
- 2615 Eagle Ridge Rd
- 108 Lonestar Rd
- 1117 N 5th Ave
- 1117 5th Ave
- 0 Apple Valley Rd
- 1040 5th Ave 2 and 4
- 1040 5th Ave 5
- 3665 Colard Ln
- 702 Ponderosa Hill Rd
- 125 Longs Peak Dr
- 1190 Lonestar Rd
- 810 Blue Mountain Rd
- 550 Blue Mountain Rd
- 978 Blue Mountain Rd
- 940 Blue Mountain Rd
- 3 Blue Mountain Rd
- 1100 Blue Mountain Rd
- 18 Blue Mountain Rd
- 2463 Steamboat Valley
- 0 Blue Mountain Rd
- 88 Blue Mountain Rd
- 111 Blue Mountain Rd
- 300 Colard Ln
- 150 Colard Ln
- 398 Colard Ln
- 38 Colard Ln
- 1 Blue Mountain Rd
- 668 Colard Ln
- 65 Colard Ln
- 140 Lake Dr
- 31 Colard Ln