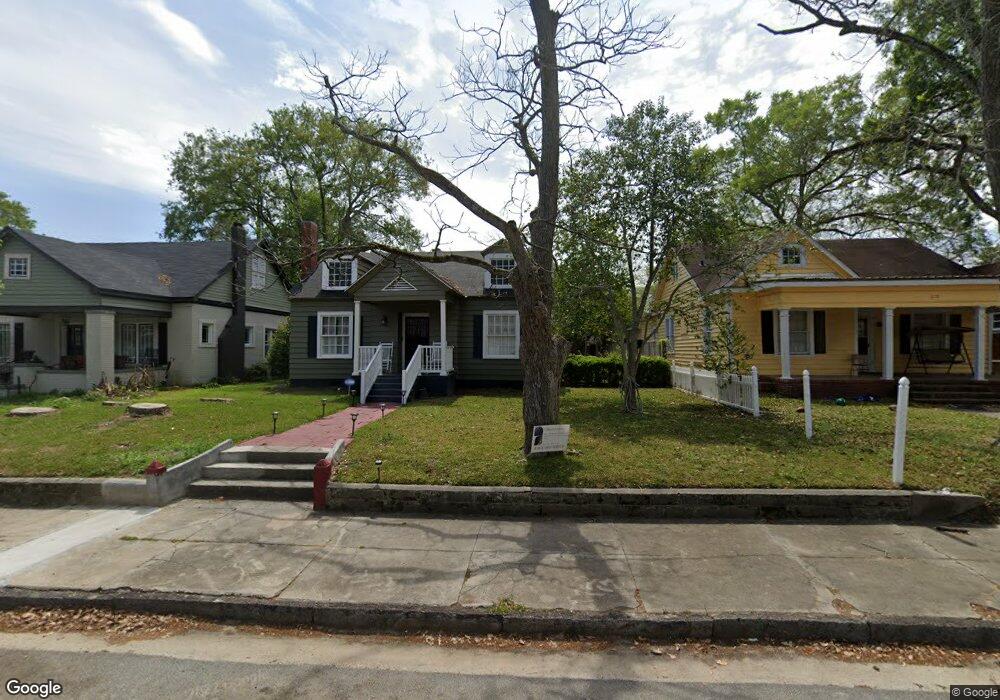
612 E 13th Ave Cordele, GA 31015
Estimated Value: $95,000 - $121,933
3
Beds
2
Baths
1,674
Sq Ft
$66/Sq Ft
Est. Value
About This Home
This home is located at 612 E 13th Ave, Cordele, GA 31015 and is currently estimated at $109,983, approximately $65 per square foot. 612 E 13th Ave is a home located in Crisp County with nearby schools including Crisp County Elementary School, Crisp County Primary School, and Crisp County Middle School.
Ownership History
Date
Name
Owned For
Owner Type
Purchase Details
Closed on
Dec 14, 2018
Sold by
Southern Builders Of Cordele Llc
Bought by
Demesier Jean and Demesier Pamela
Current Estimated Value
Home Financials for this Owner
Home Financials are based on the most recent Mortgage that was taken out on this home.
Original Mortgage
$79,797
Outstanding Balance
$70,171
Interest Rate
4.9%
Mortgage Type
New Conventional
Estimated Equity
$39,812
Purchase Details
Closed on
Oct 19, 2018
Sold by
Mccoy Joseph S
Bought by
Southern Builders Of Cordele Llc
Home Financials for this Owner
Home Financials are based on the most recent Mortgage that was taken out on this home.
Original Mortgage
$79,797
Outstanding Balance
$70,171
Interest Rate
4.9%
Mortgage Type
New Conventional
Estimated Equity
$39,812
Purchase Details
Closed on
Jun 28, 2002
Sold by
Sanneman Clarence + Florence A
Bought by
Mccoy Joseph S and Mccoy Lisa
Purchase Details
Closed on
Feb 27, 1998
Sold by
Sampson Lorraine K
Bought by
Sanneman Clarence +
Create a Home Valuation Report for This Property
The Home Valuation Report is an in-depth analysis detailing your home's value as well as a comparison with similar homes in the area
Purchase History
| Date | Buyer | Sale Price | Title Company |
|---|---|---|---|
| Demesier Jean | $79,000 | -- | |
| Southern Builders Of Cordele Llc | $74,260 | -- | |
| Mccoy Joseph S | $65,000 | -- | |
| Sanneman Clarence + | $48,000 | -- |
Source: Public Records
Mortgage History
| Date | Status | Borrower | Loan Amount |
|---|---|---|---|
| Open | Demesier Jean | $79,797 |
Source: Public Records
Tax History
| Year | Tax Paid | Tax Assessment Tax Assessment Total Assessment is a certain percentage of the fair market value that is determined by local assessors to be the total taxable value of land and additions on the property. | Land | Improvement |
|---|---|---|---|---|
| 2025 | $1,531 | $43,419 | $1,900 | $41,519 |
| 2024 | $1,403 | $39,159 | $1,900 | $37,259 |
| 2023 | $1,388 | $37,028 | $1,900 | $35,128 |
| 2022 | $922 | $34,898 | $1,900 | $32,998 |
| 2021 | $904 | $32,768 | $1,900 | $30,868 |
| 2020 | $922 | $32,768 | $1,900 | $30,868 |
| 2019 | $896 | $32,768 | $1,900 | $30,868 |
| 2018 | $669 | $24,691 | $5,067 | $19,624 |
| 2017 | $1,003 | $24,691 | $5,067 | $19,624 |
| 2016 | $671 | $24,691 | $5,067 | $19,624 |
| 2015 | -- | $24,692 | $5,067 | $19,624 |
| 2014 | -- | $24,692 | $5,067 | $19,624 |
| 2013 | -- | $24,691 | $5,067 | $19,624 |
Source: Public Records
Map
Nearby Homes
Your Personal Tour Guide
Ask me questions while you tour the home.