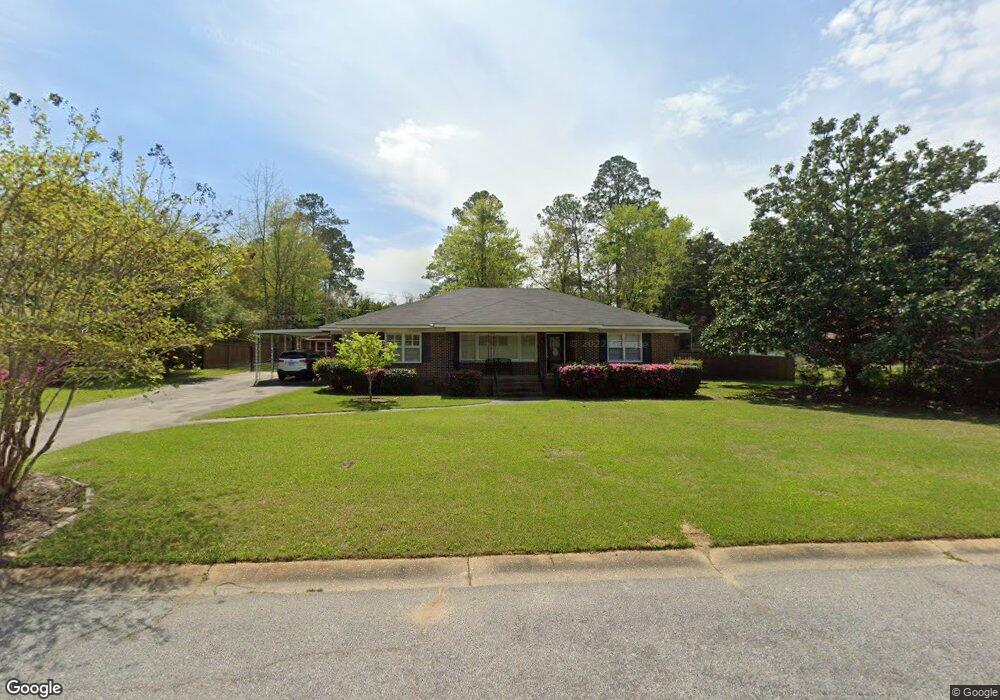
612 E 23rd Ave Cordele, GA 31015
Estimated Value: $171,466 - $217,000
3
Beds
2
Baths
2,143
Sq Ft
$90/Sq Ft
Est. Value
About This Home
This home is located at 612 E 23rd Ave, Cordele, GA 31015 and is currently estimated at $193,367, approximately $90 per square foot. 612 E 23rd Ave is a home located in Crisp County with nearby schools including Crisp County Elementary School, Crisp County Primary School, and Crisp County Middle School.
Ownership History
Date
Name
Owned For
Owner Type
Purchase Details
Closed on
Apr 5, 2019
Sold by
Howard Tiffany
Bought by
Files David J
Current Estimated Value
Home Financials for this Owner
Home Financials are based on the most recent Mortgage that was taken out on this home.
Original Mortgage
$110,461
Outstanding Balance
$96,351
Interest Rate
4.12%
Mortgage Type
FHA
Estimated Equity
$97,016
Purchase Details
Closed on
Nov 4, 2002
Sold by
Howard Les and Howard Tiffany
Bought by
Howard Tiffany
Purchase Details
Closed on
Mar 9, 1998
Sold by
Teck Tim Est Of L F
Bought by
Howard Les and Howard Tiffan
Purchase Details
Closed on
Dec 8, 1997
Sold by
Howard Les
Bought by
Howard Tiffany
Purchase Details
Closed on
Jul 18, 1997
Sold by
Ferguson Leland
Bought by
Howard Les and Howard Tiffan
Purchase Details
Closed on
Aug 11, 1955
Sold by
Williams D J Iii Et
Bought by
Ferguson Leland
Purchase Details
Closed on
Jan 18, 1955
Sold by
Williams D J Etal
Bought by
Ferguson Leland
Create a Home Valuation Report for This Property
The Home Valuation Report is an in-depth analysis detailing your home's value as well as a comparison with similar homes in the area
Purchase History
| Date | Buyer | Sale Price | Title Company |
|---|---|---|---|
| Files David J | $112,500 | -- | |
| Howard Tiffany | -- | -- | |
| Howard Les | -- | -- | |
| Howard Tiffany | -- | -- | |
| Howard Les | $68,000 | -- | |
| Ferguson Leland | -- | -- | |
| Ferguson Leland | -- | -- |
Source: Public Records
Mortgage History
| Date | Status | Borrower | Loan Amount |
|---|---|---|---|
| Open | Files David J | $110,461 |
Source: Public Records
Tax History
| Year | Tax Paid | Tax Assessment Tax Assessment Total Assessment is a certain percentage of the fair market value that is determined by local assessors to be the total taxable value of land and additions on the property. | Land | Improvement |
|---|---|---|---|---|
| 2025 | $2,174 | $64,856 | $6,144 | $58,712 |
| 2024 | $2,052 | $58,638 | $6,144 | $52,494 |
| 2023 | $1,914 | $52,457 | $3,072 | $49,385 |
| 2022 | $1,252 | $49,348 | $3,072 | $46,276 |
| 2021 | $1,227 | $46,239 | $3,072 | $43,167 |
| 2020 | $1,210 | $46,239 | $3,072 | $43,167 |
| 2019 | $1,311 | $46,239 | $3,072 | $43,167 |
| 2018 | $1,002 | $36,002 | $5,837 | $30,165 |
| 2017 | $1,462 | $36,002 | $5,837 | $30,165 |
| 2016 | $1,005 | $36,002 | $5,837 | $30,165 |
| 2015 | -- | $36,002 | $5,837 | $30,165 |
| 2014 | -- | $36,002 | $5,837 | $30,165 |
| 2013 | -- | $36,002 | $5,836 | $30,165 |
Source: Public Records
Map
Nearby Homes
Your Personal Tour Guide
Ask me questions while you tour the home.