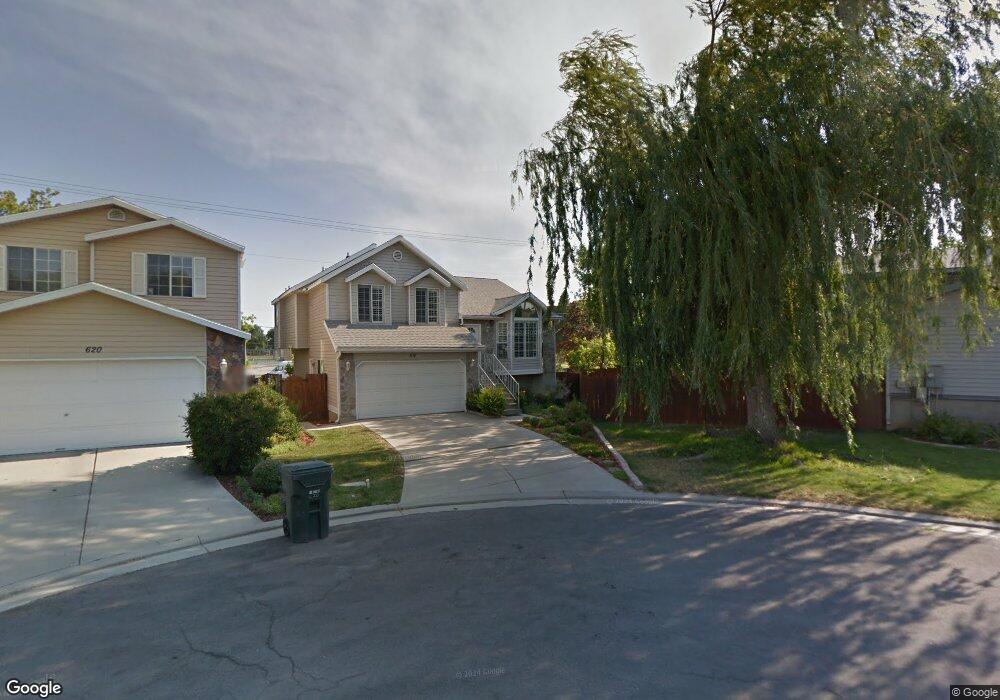
612 E Bulrush Way Salt Lake City, UT 84106
Estimated Value: $561,000 - $567,000
3
Beds
2
Baths
2,106
Sq Ft
$268/Sq Ft
Est. Value
About This Home
This home is located at 612 E Bulrush Way, Salt Lake City, UT 84106 and is currently estimated at $565,214, approximately $268 per square foot. 612 E Bulrush Way is a home located in Salt Lake County with nearby schools including Millcreek Elementary School, Woodrow Wilson Elementary School, and Granite Park Jr High School.
Ownership History
Date
Name
Owned For
Owner Type
Purchase Details
Closed on
Aug 12, 2021
Sold by
Cahoon Kenneth L and Cahoon Decca D
Bought by
Cahoon Family Trust and Cahoon
Current Estimated Value
Purchase Details
Closed on
Aug 10, 2021
Sold by
Cahoon Kenneth L and Cahoon Decca D
Bought by
Cahoon Kenneth L and Cahoon Decca D
Purchase Details
Closed on
Oct 30, 2009
Sold by
Cahoon Kenneth L
Bought by
Cahoon Kenneth L and Cahoon Decca D
Purchase Details
Closed on
Oct 12, 2005
Sold by
Cahoon Dolores L
Bought by
Cahoon Kenneth L
Purchase Details
Closed on
May 25, 1994
Sold by
Sterenbuch Hal L
Bought by
Cahoon Kenneth L and Cahoon Dolores L
Home Financials for this Owner
Home Financials are based on the most recent Mortgage that was taken out on this home.
Original Mortgage
$88,000
Interest Rate
8%
Create a Home Valuation Report for This Property
The Home Valuation Report is an in-depth analysis detailing your home's value as well as a comparison with similar homes in the area
Home Values in the Area
Average Home Value in this Area
Purchase History
| Date | Buyer | Sale Price | Title Company |
|---|---|---|---|
| Cahoon Family Trust | -- | None Listed On Document | |
| Cahoon Kenneth L | -- | None Available | |
| Cahoon Kenneth L | -- | None Available | |
| Cahoon Kenneth L | -- | None Available | |
| Cahoon Kenneth L | -- | -- |
Source: Public Records
Mortgage History
| Date | Status | Borrower | Loan Amount |
|---|---|---|---|
| Previous Owner | Cahoon Kenneth L | $88,000 |
Source: Public Records
Tax History Compared to Growth
Tax History
| Year | Tax Paid | Tax Assessment Tax Assessment Total Assessment is a certain percentage of the fair market value that is determined by local assessors to be the total taxable value of land and additions on the property. | Land | Improvement |
|---|---|---|---|---|
| 2025 | -- | $524,400 | $134,100 | $390,300 |
| 2024 | -- | $473,100 | $127,000 | $346,100 |
| 2023 | -- | $453,400 | $122,100 | $331,300 |
| 2022 | $0 | $459,100 | $119,700 | $339,400 |
| 2021 | $2,381 | $368,700 | $93,000 | $275,700 |
| 2020 | $2,221 | $327,300 | $83,000 | $244,300 |
| 2019 | $2,188 | $312,900 | $76,800 | $236,100 |
| 2018 | $0 | $283,900 | $76,800 | $207,100 |
| 2017 | $1,896 | $273,000 | $76,800 | $196,200 |
| 2016 | $1,759 | $250,000 | $64,600 | $185,400 |
| 2015 | $1,655 | $219,800 | $60,100 | $159,700 |
| 2014 | $1,689 | $220,100 | $62,100 | $158,000 |
Source: Public Records
Map
Nearby Homes
- 465 E 3300 S
- 470 E Stanley Ave
- 328 3390 S Unit 11
- 314 3390 S Unit 7
- 316 3390 S Unit 8
- 326 3390 S Unit 12
- 458 E Lambourne Ave
- 3346 S 700 E
- 406 E 3335 S Unit 15
- 3184 S 400 E
- 736 E 3155 S
- 346 E 3300 S
- 340 E 3300 S
- 766 E Spring View Dr
- 3091 S 700 E
- 350 E Mansfield Ave
- 405 E Scott Ave
- 3073 S 700 E
- 751 E Scott Ave
- 311 E 3360 S
- 612 Bulrush Way
- 584 Bulrush Way
- 584 E Bulrush Way
- 620 Bulrush Way
- 572 Bulrush Way
- 3287 Water Lily Dr
- 568 Bulrush Way
- 3277 Water Lily Dr
- 3277 S Water Lily Dr
- 500 E 3300 S
- 500 E 3300 S
- 583 Bulrush Way
- 3265 Water Lily Dr
- 575 Bulrush Way
- 550 Bulrush Way
- 550 E Bulrush Way
- 565 Bulrush Way
- 551 Bulrush Way
- 3247 Water Lily Dr
- 542 Bulrush Way