Estimated Value: $279,000 - $290,000
3
Beds
2
Baths
1,593
Sq Ft
$178/Sq Ft
Est. Value
About This Home
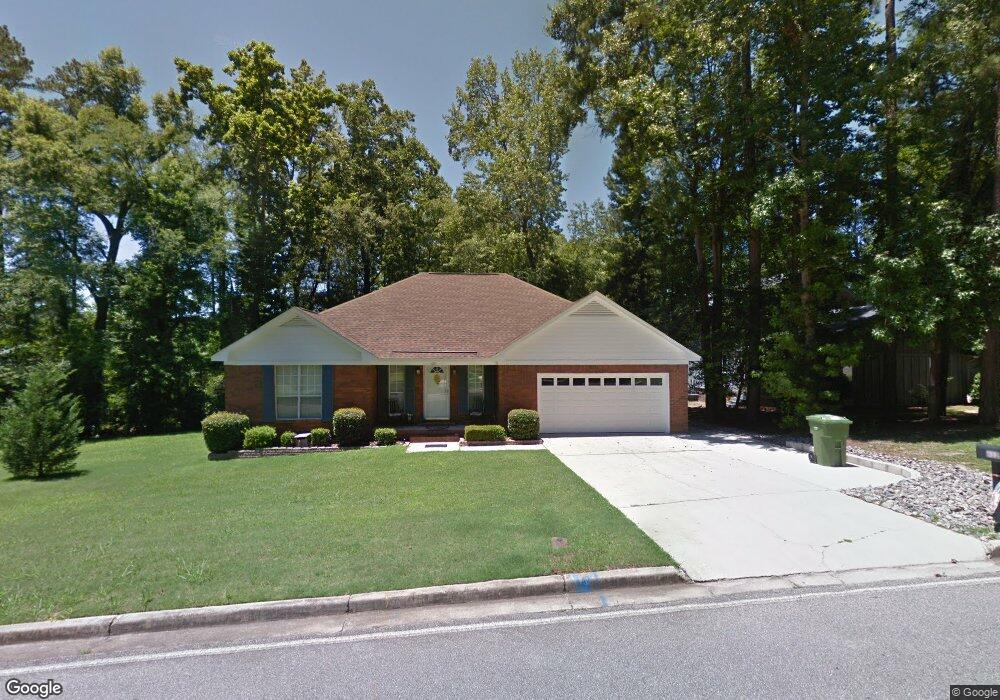
This home is located at 612 Fieldstone Way, Evans, GA 30809 and is currently estimated at $284,238, approximately $178 per square foot. 612 Fieldstone Way is a home located in Columbia County with nearby schools including River Ridge Elementary School, Riverside Middle School, and Lakeside High School.
Ownership History
Date
Name
Owned For
Owner Type
Purchase Details
Closed on
Jul 15, 2014
Sold by
Fulmer Joyce Dunn
Bought by
Fulmer Joyce Dunn and Newsome John David
Current Estimated Value
Purchase Details
Closed on
Sep 10, 2010
Sold by
Kuo Kuan Shiu
Bought by
Fulmer Greg L
Purchase Details
Closed on
Nov 7, 2005
Sold by
Austin Ann S
Bought by
Kuo Kuan Shiu and Tan Kuo Susie H H
Home Financials for this Owner
Home Financials are based on the most recent Mortgage that was taken out on this home.
Original Mortgage
$112,000
Interest Rate
5.48%
Mortgage Type
New Conventional
Purchase Details
Closed on
Sep 29, 2005
Sold by
Austin Ann S
Bought by
Kuo Kuan Shiu and Tan Kuo Susie H H
Home Financials for this Owner
Home Financials are based on the most recent Mortgage that was taken out on this home.
Original Mortgage
$112,000
Interest Rate
5.48%
Mortgage Type
New Conventional
Create a Home Valuation Report for This Property
The Home Valuation Report is an in-depth analysis detailing your home's value as well as a comparison with similar homes in the area
Home Values in the Area
Average Home Value in this Area
Purchase History
| Date | Buyer | Sale Price | Title Company |
|---|---|---|---|
| Fulmer Joyce Dunn | -- | -- | |
| Fulmer Greg L | $149,000 | -- | |
| Kuo Kuan Shiu | $140,000 | -- | |
| Kuo Kuan Shiu | -- | -- |
Source: Public Records
Mortgage History
| Date | Status | Borrower | Loan Amount |
|---|---|---|---|
| Previous Owner | Kuo Kuan Shiu | $112,000 |
Source: Public Records
Tax History Compared to Growth
Tax History
| Year | Tax Paid | Tax Assessment Tax Assessment Total Assessment is a certain percentage of the fair market value that is determined by local assessors to be the total taxable value of land and additions on the property. | Land | Improvement |
|---|---|---|---|---|
| 2025 | $909 | $113,583 | $22,188 | $91,395 |
| 2024 | $918 | $110,806 | $22,188 | $88,618 |
| 2023 | $1,268 | $105,066 | $22,188 | $82,878 |
| 2022 | $1,291 | $87,403 | $17,139 | $70,264 |
| 2021 | $1,040 | $76,055 | $15,852 | $60,203 |
| 2020 | $868 | $69,127 | $14,466 | $54,661 |
| 2019 | $769 | $65,549 | $14,268 | $51,281 |
| 2018 | $691 | $62,660 | $14,070 | $48,590 |
| 2017 | $618 | $59,955 | $13,476 | $46,479 |
| 2016 | $554 | $58,337 | $12,858 | $45,479 |
| 2015 | $60 | $55,438 | $11,967 | $43,471 |
| 2014 | $1,440 | $52,478 | $11,769 | $40,709 |
Source: Public Records
Map
Nearby Homes
- 2975 Rosewood Dr
- 726 Whitney Shoals Rd
- 2994 Rosewood Dr
- 776 Faircloth Commons Rd
- 580 Country Place Ln
- 4489 Woodberry Ct
- 4560 Mulberry Creek Dr
- 4482 Persimmon St
- 4614 Stoneridge Ct
- 854 Sparkleberry Rd
- 800 Sparkleberry Rd
- 802 Sparkleberry Rd
- 829 Woodberry Dr
- 646 Wellington Dr
- 656 Deerwood Way
- 604 Barberry Ct
- 4507 Amanda Ln
- 667 Steeplechase Way
- 658 Wellington Dr
- 14 Plantation Hills Dr
- 614 Fieldstone Way
- 679 Chimney Hill Cir
- 679 Chimney Hill Cir N
- 611 Fieldstone Way
- 607 Chimney Hill Cir
- 677 Chimney Hill Cir
- 618 Fieldstone Way
- 609 Chimney Hill Cir
- 676 Chimney Hill Cir
- 4473 Washington Rd
- 617 Fieldstone Way
- 675 Chimney Hill Cir N
- 674 Chimney Hill Cir
- 674 Chimney Hill Cir N
- 611 Chimney Hill Cir
- 614 Chimney Hill Cir
- 619 Fieldstone Way
- 620 Fieldstone Way
- 672 Chimney Hill Cir
- 673 Chimney Hill Cir