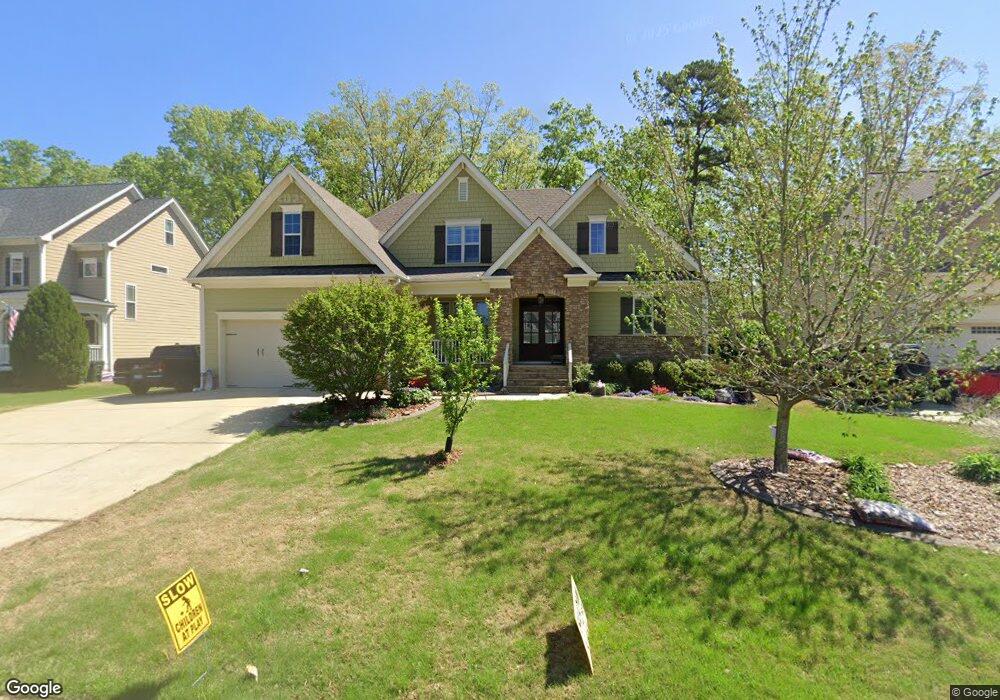
612 Hollymont Dr Holly Springs, NC 27540
Estimated Value: $730,000 - $795,000
4
Beds
4
Baths
3,301
Sq Ft
$227/Sq Ft
Est. Value
About This Home
This home is located at 612 Hollymont Dr, Holly Springs, NC 27540 and is currently estimated at $748,833, approximately $226 per square foot. 612 Hollymont Dr is a home located in Wake County with nearby schools including Holly Grove Elementary School, Holly Grove Middle School, and Holly Springs High School.
Ownership History
Date
Name
Owned For
Owner Type
Purchase Details
Closed on
Aug 19, 2019
Sold by
Alesio Frank A D and Alesio Deborah A D
Bought by
Bachhuber Jason John and Bachhuber Rami Josephine
Current Estimated Value
Home Financials for this Owner
Home Financials are based on the most recent Mortgage that was taken out on this home.
Original Mortgage
$180,000
Outstanding Balance
$157,647
Interest Rate
3.7%
Mortgage Type
New Conventional
Estimated Equity
$591,186
Purchase Details
Closed on
Aug 26, 2013
Sold by
J M Davis Custom Homes Inc
Bought by
Dalesio Frank A and Dalesio Deborah A
Home Financials for this Owner
Home Financials are based on the most recent Mortgage that was taken out on this home.
Original Mortgage
$338,320
Interest Rate
4.48%
Mortgage Type
New Conventional
Purchase Details
Closed on
Mar 26, 2013
Sold by
Highlands Lot Holdings Llc
Bought by
J M Davis Custom Homes Inc
Create a Home Valuation Report for This Property
The Home Valuation Report is an in-depth analysis detailing your home's value as well as a comparison with similar homes in the area
Home Values in the Area
Average Home Value in this Area
Purchase History
| Date | Buyer | Sale Price | Title Company |
|---|---|---|---|
| Bachhuber Jason John | $479,000 | None Available | |
| Dalesio Frank A | $423,000 | None Available | |
| J M Davis Custom Homes Inc | $206,000 | None Available |
Source: Public Records
Mortgage History
| Date | Status | Borrower | Loan Amount |
|---|---|---|---|
| Open | Bachhuber Jason John | $180,000 | |
| Previous Owner | Dalesio Frank A | $338,320 |
Source: Public Records
Tax History Compared to Growth
Tax History
| Year | Tax Paid | Tax Assessment Tax Assessment Total Assessment is a certain percentage of the fair market value that is determined by local assessors to be the total taxable value of land and additions on the property. | Land | Improvement |
|---|---|---|---|---|
| 2025 | $6,210 | $719,207 | $125,000 | $594,207 |
| 2024 | $6,184 | $719,207 | $125,000 | $594,207 |
| 2023 | $5,117 | $472,576 | $65,000 | $407,576 |
| 2022 | $4,940 | $472,576 | $65,000 | $407,576 |
| 2021 | $4,848 | $472,576 | $65,000 | $407,576 |
| 2020 | $4,848 | $472,576 | $65,000 | $407,576 |
| 2019 | $5,123 | $424,086 | $75,000 | $349,086 |
| 2018 | $4,524 | $414,407 | $75,000 | $339,407 |
| 2017 | $4,361 | $414,407 | $75,000 | $339,407 |
| 2016 | $4,301 | $414,407 | $75,000 | $339,407 |
| 2015 | $4,228 | $400,932 | $46,000 | $354,932 |
| 2014 | $4,081 | $46,000 | $46,000 | $0 |
Source: Public Records
Map
Nearby Homes
- 233 Hickory Glen Ln
- 933 Hollymont Dr
- 161 Summit Oaks Ln
- 505 Pyracantha Dr
- 213 Holly Moor Ln
- 208 Autumn Glen Ln
- 304 Magnolia Meadow Way
- 100 Avent Pines Ln
- 101 Covenant Rock Ln
- 1712 Avent Ferry Rd
- 341 Covenant Rock Ln
- 113 Braxman Ln
- 300 Shorehouse Way
- 417 Shorehouse Way
- 100 Oakmoss Trail
- 425 Cahors Trail
- 0 Old Airport Rd
- 104 Pointe Park Cir
- 108 Pointe Park Cir
- 305 Tonks Trail
- 608 Hollymont Dr
- 700 Hollymont Dr
- 216 Holly Green Ln
- 604 Hollymont Dr
- 704 Hollymont Dr
- 220 Holly Green Ln
- 609 Hollymont Dr
- 605 Hollymont Dr
- 117 Acorn Ridge Ln
- 212 Holly Green Ln
- 701 Hollymont Dr
- 600 Hollymont Dr
- 708 Hollymont Dr
- 224 Holly Green Ln
- 116 Acorn Ridge Ln
- 1129 Hollymont Dr
- 705 Hollymont Dr
- 105 Roslin Way
- 512 Hollymont Dr
- 712 Hollymont Dr