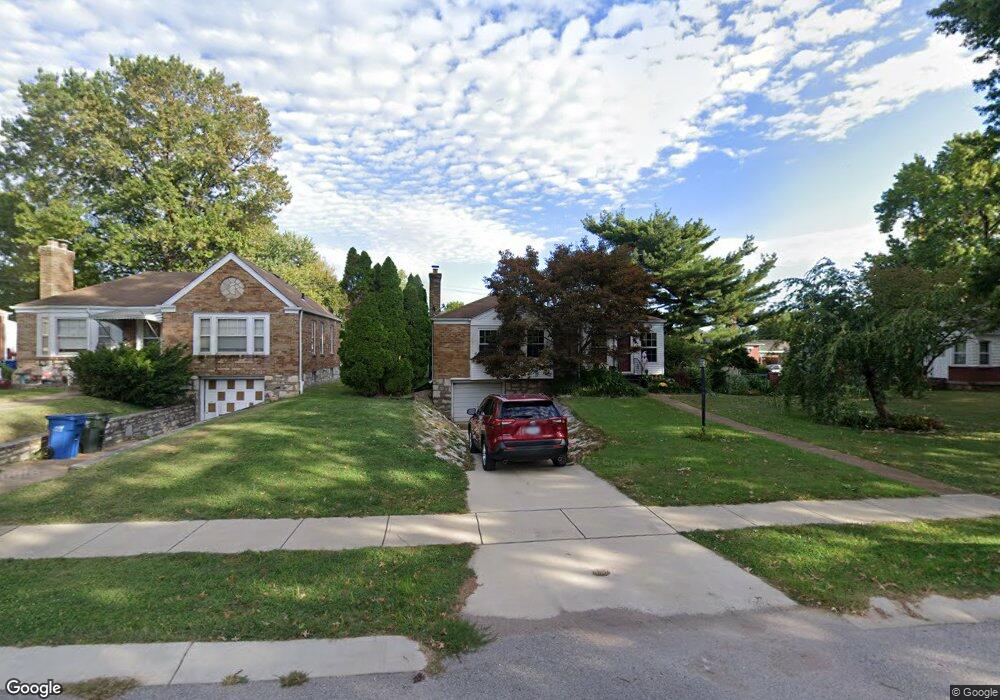
612 Landor Ct Saint Louis, MO 63125
Lemay NeighborhoodEstimated Value: $189,000 - $220,000
2
Beds
2
Baths
1,174
Sq Ft
$169/Sq Ft
Est. Value
About This Home
This home is located at 612 Landor Ct, Saint Louis, MO 63125 and is currently estimated at $197,905, approximately $168 per square foot. 612 Landor Ct is a home located in St. Louis County with nearby schools including Hancock Place Elementary School, Hancock Place Middle School, and Hancock Place High School.
Ownership History
Date
Name
Owned For
Owner Type
Purchase Details
Closed on
Aug 25, 2017
Sold by
Wildhaber Jeffrey D
Bought by
Abernathy Daniel J
Current Estimated Value
Home Financials for this Owner
Home Financials are based on the most recent Mortgage that was taken out on this home.
Original Mortgage
$121,164
Outstanding Balance
$100,828
Interest Rate
3.86%
Estimated Equity
$97,077
Purchase Details
Closed on
Oct 22, 2013
Sold by
Rapp Brandon and Rapp Garilyn
Bought by
Gross Helga M
Purchase Details
Closed on
Jul 31, 2003
Sold by
Kelly Lawrence Edward
Bought by
Rapp Brandon and Rapp Garilynn
Home Financials for this Owner
Home Financials are based on the most recent Mortgage that was taken out on this home.
Original Mortgage
$117,438
Interest Rate
5.51%
Mortgage Type
FHA
Purchase Details
Closed on
May 28, 2002
Sold by
Kelly Lawrence Edward
Bought by
Kelly Patricia Ellen
Purchase Details
Closed on
Sep 27, 1999
Sold by
Flori Shirlie A
Bought by
Oneil Kevin M and Flori William J
Create a Home Valuation Report for This Property
The Home Valuation Report is an in-depth analysis detailing your home's value as well as a comparison with similar homes in the area
Home Values in the Area
Average Home Value in this Area
Purchase History
| Date | Buyer | Sale Price | Title Company |
|---|---|---|---|
| Abernathy Daniel J | $142,500 | -- | |
| Gross Helga M | $109,000 | Investors Title Co Clayton | |
| Rapp Brandon | $119,900 | -- | |
| Kelly Patricia Ellen | -- | -- | |
| Kelly Lawrence Edward | $114,900 | -- | |
| Oneil Kevin M | -- | -- |
Source: Public Records
Mortgage History
| Date | Status | Borrower | Loan Amount |
|---|---|---|---|
| Open | Abernathy Daniel J | $121,164 | |
| Closed | Abernathy Daniel J | -- | |
| Previous Owner | Rapp Brandon | $117,438 |
Source: Public Records
Tax History Compared to Growth
Tax History
| Year | Tax Paid | Tax Assessment Tax Assessment Total Assessment is a certain percentage of the fair market value that is determined by local assessors to be the total taxable value of land and additions on the property. | Land | Improvement |
|---|---|---|---|---|
| 2025 | $2,405 | $38,480 | $13,490 | $24,990 |
| 2024 | $2,405 | $30,780 | $5,400 | $25,380 |
| 2023 | $2,285 | $30,780 | $5,400 | $25,380 |
| 2022 | $2,215 | $27,040 | $6,230 | $20,810 |
| 2021 | $2,177 | $27,040 | $6,230 | $20,810 |
| 2020 | $1,923 | $22,750 | $5,970 | $16,780 |
| 2019 | $1,918 | $22,750 | $5,970 | $16,780 |
| 2018 | $1,812 | $18,720 | $4,640 | $14,080 |
| 2017 | $1,781 | $18,720 | $4,640 | $14,080 |
| 2016 | $1,627 | $16,440 | $3,310 | $13,130 |
| 2015 | $1,619 | $16,440 | $3,310 | $13,130 |
| 2014 | $1,803 | $19,530 | $6,210 | $13,320 |
Source: Public Records
Map
Nearby Homes
- 3806 Waller Ave
- 514 E Dallas Ct
- 622 Kayser Ave
- 610 Kayser Ave
- 765 Pardella Ave Unit A
- 711 Erskine Ave
- 715 Erskine Ave
- 8626 Shoss Ave
- 720 Erskine Ave
- 252 Wachtel Ave
- 241 Dammert Ave
- 235 Military Rd
- 302 Waller Ave
- 300 Kayser Ave
- 735 Dammert Ave
- 8439 Tennessee Ave
- 8523 Idaho Ave
- 437 Hoffmeister Ave
- 522 Lagro Ave
- 363 Hoffmeister Ave