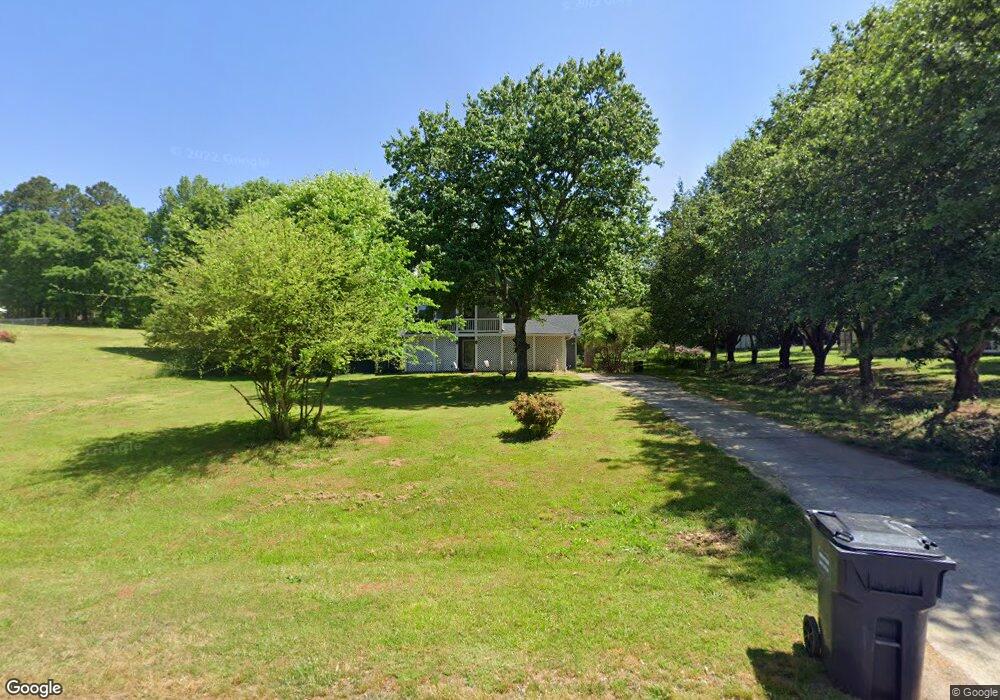
612 Leigh Ct Unit 1 Winder, GA 30680
Estimated Value: $253,000 - $299,000
3
Beds
2
Baths
1,315
Sq Ft
$209/Sq Ft
Est. Value
About This Home
This home is located at 612 Leigh Ct Unit 1, Winder, GA 30680 and is currently estimated at $274,571, approximately $208 per square foot. 612 Leigh Ct Unit 1 is a home located in Barrow County with nearby schools including Holsenbeck Elementary School, Bear Creek Middle School, and Winder-Barrow High School.
Ownership History
Date
Name
Owned For
Owner Type
Purchase Details
Closed on
Oct 24, 2006
Sold by
Roxburgh Kevin E
Bought by
Roxburgh Rebecca D
Current Estimated Value
Home Financials for this Owner
Home Financials are based on the most recent Mortgage that was taken out on this home.
Original Mortgage
$80,388
Outstanding Balance
$47,783
Interest Rate
6.39%
Mortgage Type
FHA
Estimated Equity
$226,788
Purchase Details
Closed on
Jun 7, 2006
Sold by
Roxburgh Kevin E
Bought by
Roxburgh Rebecca Dawn Christian
Purchase Details
Closed on
Dec 7, 2001
Sold by
Lazenby Patricia
Bought by
Roxburgh Kevin E
Home Financials for this Owner
Home Financials are based on the most recent Mortgage that was taken out on this home.
Original Mortgage
$69,020
Interest Rate
6.6%
Mortgage Type
FHA
Purchase Details
Closed on
Jan 31, 1997
Sold by
Allison Ronny
Bought by
Lazenby Patricia
Purchase Details
Closed on
Aug 1, 1990
Bought by
Allison Ronny L
Create a Home Valuation Report for This Property
The Home Valuation Report is an in-depth analysis detailing your home's value as well as a comparison with similar homes in the area
Home Values in the Area
Average Home Value in this Area
Purchase History
| Date | Buyer | Sale Price | Title Company |
|---|---|---|---|
| Roxburgh Rebecca D | -- | -- | |
| Roxburgh Rebecca Dawn Christian | -- | -- | |
| Roxburgh Kevin E | $80,000 | -- | |
| Lazenby Patricia | $77,400 | -- | |
| Allison Ronny L | $52,500 | -- |
Source: Public Records
Mortgage History
| Date | Status | Borrower | Loan Amount |
|---|---|---|---|
| Open | Roxburgh Rebecca D | $80,388 | |
| Previous Owner | Roxburgh Kevin E | $69,020 | |
| Closed | Lazenby Patricia | $0 |
Source: Public Records
Tax History Compared to Growth
Tax History
| Year | Tax Paid | Tax Assessment Tax Assessment Total Assessment is a certain percentage of the fair market value that is determined by local assessors to be the total taxable value of land and additions on the property. | Land | Improvement |
|---|---|---|---|---|
| 2024 | $1,682 | $77,141 | $19,200 | $57,941 |
| 2023 | $1,276 | $77,621 | $19,200 | $58,421 |
| 2022 | $1,780 | $71,260 | $16,400 | $54,860 |
| 2021 | $1,545 | $58,196 | $12,800 | $45,396 |
| 2020 | $1,378 | $51,340 | $10,000 | $41,340 |
| 2019 | $1,300 | $47,284 | $10,000 | $37,284 |
| 2018 | $1,176 | $43,020 | $10,000 | $33,020 |
| 2017 | $878 | $30,168 | $10,000 | $20,168 |
| 2016 | $847 | $30,430 | $10,000 | $20,430 |
| 2015 | $859 | $30,692 | $10,000 | $20,692 |
| 2014 | $714 | $26,116 | $4,900 | $21,216 |
| 2013 | -- | $25,172 | $4,900 | $20,272 |
Source: Public Records
Map
Nearby Homes
- 273 Greystone Ct
- 547 Hickeria Way
- 662 Carla Ct
- 421 Arrowhatchee Dr
- 826 Crystal Meadow Dr
- 372 Ashton Way
- 855 Crystal Meadow Dr
- 475 Pendergrass Rd
- 752 Moon Bridge Rd
- 303 Rooks Rd
- 466 Pendergrass Rd
- 722 Moonlite Trace
- 624 Skyland Dr
- 809 Moon Bridge Rd
- 1811 Alberta Ln
- 457 Banff Dr
- 1815 Alberta Ln
- 58 Cedar Bluff
- 0 Leigh Ct
- 610 Leigh Ct
- 610 Leigh Ct Unit 1
- 614 Leigh Ct
- 505 Rockwell Church Rd NE
- 608 Leigh Ct Unit 3
- 608 Leigh Ct
- 611 Leigh Ct
- 616 Leigh Ct Unit 1
- 609 Leigh Ct
- 613 Leigh Ct
- 606 Warren Way
- 523 Hilldale Cir
- 511 Rockwell Church Rd NE
- 525 Hilldale Cir
- 521 Hilldale Cir
- 607 Leigh Ct Unit 1
- 607 Leigh Ct
- 481 Rockwell Church Rd NE
- 604 Warren Way