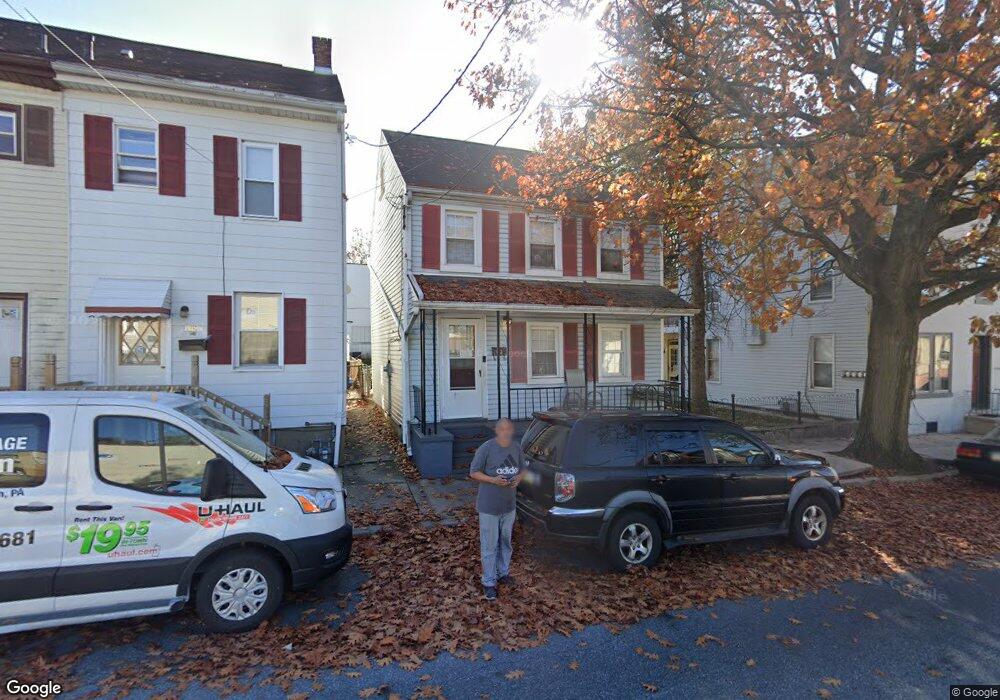
612 Locust St Lebanon, PA 17042
Estimated Value: $154,000 - $170,962
4
Beds
1
Bath
1,305
Sq Ft
$125/Sq Ft
Est. Value
About This Home
This home is located at 612 Locust St, Lebanon, PA 17042 and is currently estimated at $163,491, approximately $125 per square foot. 612 Locust St is a home located in Lebanon County with nearby schools including Harding Elementary School, Lebanon Intermediate School, and Lebanon Senior High School.
Ownership History
Date
Name
Owned For
Owner Type
Purchase Details
Closed on
Oct 10, 2008
Sold by
Beloo Community Credit Union
Bought by
Stoner Sheena D and Leslie Stoner A
Current Estimated Value
Home Financials for this Owner
Home Financials are based on the most recent Mortgage that was taken out on this home.
Original Mortgage
$41,600
Outstanding Balance
$27,637
Interest Rate
6.41%
Mortgage Type
New Conventional
Estimated Equity
$135,854
Purchase Details
Closed on
Jan 16, 2007
Sold by
Neil Vicki L
Bought by
Belco Community Credit Union
Create a Home Valuation Report for This Property
The Home Valuation Report is an in-depth analysis detailing your home's value as well as a comparison with similar homes in the area
Home Values in the Area
Average Home Value in this Area
Purchase History
| Date | Buyer | Sale Price | Title Company |
|---|---|---|---|
| Stoner Sheena D | $52,000 | None Available | |
| Belco Community Credit Union | $52,000 | None Available |
Source: Public Records
Mortgage History
| Date | Status | Borrower | Loan Amount |
|---|---|---|---|
| Open | Stoner Sheena D | $41,600 |
Source: Public Records
Tax History Compared to Growth
Tax History
| Year | Tax Paid | Tax Assessment Tax Assessment Total Assessment is a certain percentage of the fair market value that is determined by local assessors to be the total taxable value of land and additions on the property. | Land | Improvement |
|---|---|---|---|---|
| 2025 | $2,300 | $71,400 | $6,500 | $64,900 |
| 2024 | $2,192 | $71,400 | $6,500 | $64,900 |
| 2023 | $1,587 | $71,400 | $6,500 | $64,900 |
| 2022 | $1,587 | $71,400 | $6,500 | $64,900 |
| 2021 | $2,082 | $71,400 | $6,500 | $64,900 |
| 2020 | $2,082 | $71,400 | $6,500 | $64,900 |
| 2019 | $2,052 | $71,400 | $6,500 | $64,900 |
| 2018 | $1,993 | $71,400 | $6,500 | $64,900 |
| 2017 | $562 | $71,400 | $6,500 | $64,900 |
| 2016 | $1,940 | $71,400 | $6,500 | $64,900 |
| 2015 | $1,333 | $71,400 | $6,500 | $64,900 |
| 2014 | $1,333 | $71,400 | $6,500 | $64,900 |
Source: Public Records
Map
Nearby Homes