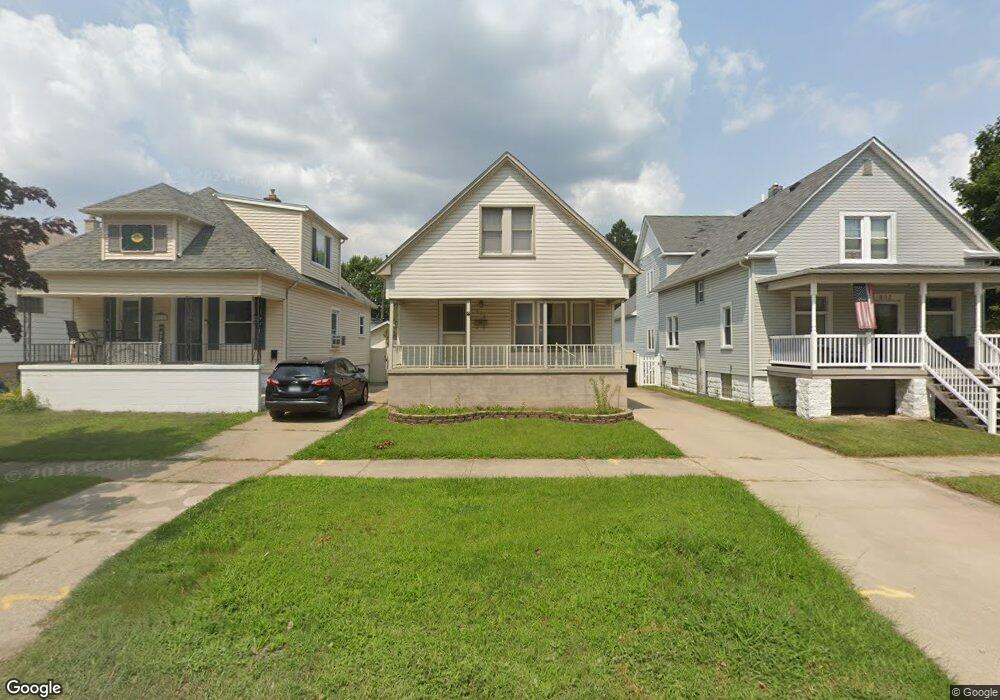
612 Maple St Wyandotte, MI 48192
Estimated Value: $153,211 - $235,000
--
Bed
--
Bath
1,107
Sq Ft
$175/Sq Ft
Est. Value
About This Home
This home is located at 612 Maple St, Wyandotte, MI 48192 and is currently estimated at $193,803, approximately $175 per square foot. 612 Maple St is a home located in Wayne County with nearby schools including James A. Garfield Elementary School, Woodrow Wilson School, and Roosevelt High School.
Ownership History
Date
Name
Owned For
Owner Type
Purchase Details
Closed on
Jul 8, 2011
Sold by
Desana Michael J and Desana Christopher M
Bought by
Stamps Vicci
Current Estimated Value
Home Financials for this Owner
Home Financials are based on the most recent Mortgage that was taken out on this home.
Original Mortgage
$61,402
Outstanding Balance
$43,438
Interest Rate
5.12%
Mortgage Type
FHA
Estimated Equity
$150,365
Purchase Details
Closed on
Sep 29, 2003
Sold by
Desana Beulah R and Desana Beulah
Bought by
Desana Michael J
Create a Home Valuation Report for This Property
The Home Valuation Report is an in-depth analysis detailing your home's value as well as a comparison with similar homes in the area
Home Values in the Area
Average Home Value in this Area
Purchase History
| Date | Buyer | Sale Price | Title Company |
|---|---|---|---|
| Stamps Vicci | $63,000 | Michigan Title Insurance Age | |
| Desana Michael J | -- | Great Lakes Title Of Michiga | |
| Desana Michael J | -- | Great Lakes Title Of Michiga |
Source: Public Records
Mortgage History
| Date | Status | Borrower | Loan Amount |
|---|---|---|---|
| Open | Stamps Vicci | $61,402 |
Source: Public Records
Tax History Compared to Growth
Tax History
| Year | Tax Paid | Tax Assessment Tax Assessment Total Assessment is a certain percentage of the fair market value that is determined by local assessors to be the total taxable value of land and additions on the property. | Land | Improvement |
|---|---|---|---|---|
| 2025 | $1,713 | $75,700 | $0 | $0 |
| 2024 | $1,713 | $71,500 | $0 | $0 |
| 2023 | $1,634 | $64,900 | $0 | $0 |
| 2022 | $1,892 | $58,700 | $0 | $0 |
| 2021 | $1,854 | $55,900 | $0 | $0 |
| 2020 | $1,829 | $47,900 | $0 | $0 |
| 2019 | $1,803 | $43,000 | $0 | $0 |
| 2018 | $1,440 | $38,600 | $0 | $0 |
| 2017 | $631 | $38,600 | $0 | $0 |
| 2016 | $1,741 | $35,400 | $0 | $0 |
| 2015 | $3,107 | $32,900 | $0 | $0 |
| 2013 | $3,010 | $30,100 | $0 | $0 |
| 2012 | $1,304 | $31,500 | $7,800 | $23,700 |
Source: Public Records
Map
Nearby Homes