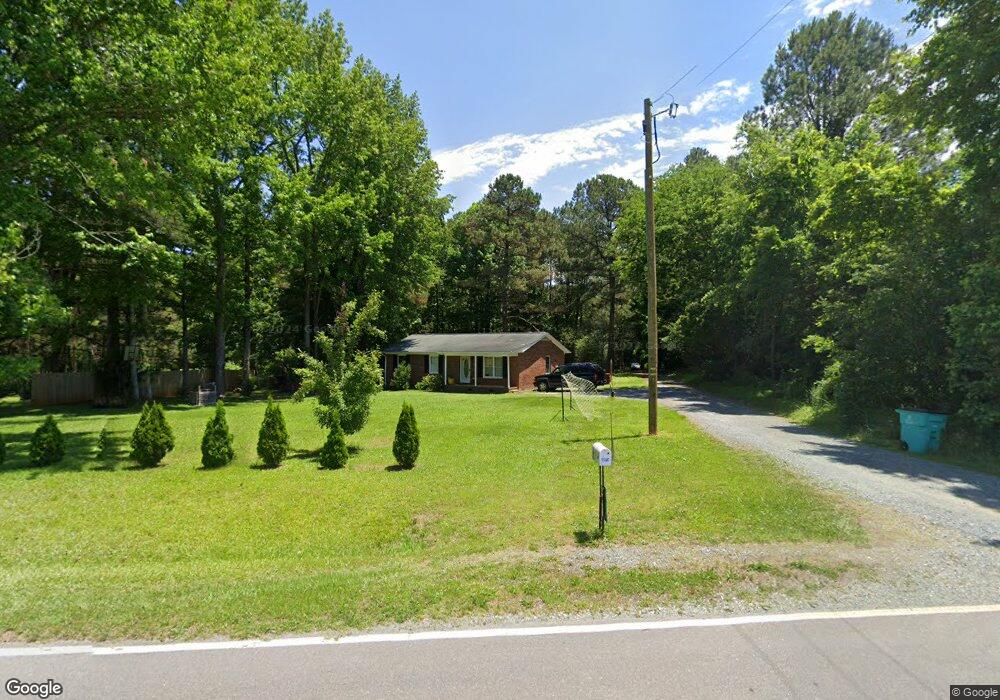
612 Mitchells Chapel Rd Pittsboro, NC 27312
Estimated Value: $230,000 - $324,000
3
Beds
1
Bath
1,147
Sq Ft
$251/Sq Ft
Est. Value
About This Home
This home is located at 612 Mitchells Chapel Rd, Pittsboro, NC 27312 and is currently estimated at $287,991, approximately $251 per square foot. 612 Mitchells Chapel Rd is a home located in Chatham County with nearby schools including Pittsboro Elementary School, George Moses Horton Middle School, and Northwood High.
Ownership History
Date
Name
Owned For
Owner Type
Purchase Details
Closed on
Oct 13, 2015
Sold by
Green Branch Development Llc
Bought by
Villa Moreno Barnabe and Reyes Cantador Luz M
Current Estimated Value
Home Financials for this Owner
Home Financials are based on the most recent Mortgage that was taken out on this home.
Original Mortgage
$92,700
Outstanding Balance
$55,328
Interest Rate
3.93%
Mortgage Type
New Conventional
Estimated Equity
$232,663
Purchase Details
Closed on
Mar 2, 2015
Sold by
Laws Davis Brice Collin and Laws Davis Amber
Bought by
Green Branch Development Llc
Purchase Details
Closed on
Sep 11, 2006
Sold by
White Janay J and Collins Ronald P
Bought by
Laws Davis Brice Collin and Laws Davis Amber
Home Financials for this Owner
Home Financials are based on the most recent Mortgage that was taken out on this home.
Original Mortgage
$101,000
Interest Rate
6.25%
Mortgage Type
Purchase Money Mortgage
Create a Home Valuation Report for This Property
The Home Valuation Report is an in-depth analysis detailing your home's value as well as a comparison with similar homes in the area
Home Values in the Area
Average Home Value in this Area
Purchase History
| Date | Buyer | Sale Price | Title Company |
|---|---|---|---|
| Villa Moreno Barnabe | $103,000 | Attorney | |
| Green Branch Development Llc | $101,500 | None Available | |
| Laws Davis Brice Collin | $100,000 | None Available |
Source: Public Records
Mortgage History
| Date | Status | Borrower | Loan Amount |
|---|---|---|---|
| Open | Villa Moreno Barnabe | $92,700 | |
| Previous Owner | Laws Davis Brice Collin | $101,000 |
Source: Public Records
Tax History Compared to Growth
Tax History
| Year | Tax Paid | Tax Assessment Tax Assessment Total Assessment is a certain percentage of the fair market value that is determined by local assessors to be the total taxable value of land and additions on the property. | Land | Improvement |
|---|---|---|---|---|
| 2025 | $2,160 | $282,117 | $75,000 | $207,117 |
| 2024 | $2,160 | $206,417 | $67,000 | $139,417 |
| 2023 | $1,928 | $206,417 | $67,000 | $139,417 |
| 2022 | $1,759 | $206,417 | $67,000 | $139,417 |
| 2021 | $1,759 | $206,417 | $67,000 | $139,417 |
| 2020 | $1,304 | $148,774 | $37,500 | $111,274 |
| 2019 | $1,304 | $148,774 | $37,500 | $111,274 |
| 2018 | $1,242 | $148,774 | $37,500 | $111,274 |
| 2017 | $1,242 | $148,774 | $37,500 | $111,274 |
| 2016 | $1,029 | $119,573 | $30,000 | $89,573 |
| 2015 | $1,015 | $119,573 | $30,000 | $89,573 |
| 2014 | $1,007 | $119,573 | $30,000 | $89,573 |
| 2013 | -- | $119,573 | $30,000 | $89,573 |
Source: Public Records
Map
Nearby Homes
- 1701 Mitchells Chapel Rd
- 126 Roberson Creek Rd
- Tbd Jahue Ln
- 0 Robert Alston Jr Dr Unit 2491587
- 323 Wagon Trace
- 1210 Manco Dairy Rd
- TBD Alston Horton Service Rd
- 520 Swim and Croquet
- 226 John Williams Ln
- Lot 1 B Turkey Buzzard Ln
- 303 Wendover Pkwy
- 0 Major Lee Rd Unit 10134911
- 127 Preston Trace
- 248 Ashford Dr
- Lot 1 C Turkey Buzzard Ln
- Lot 1 D Turkey Buzzard Ln
- 259 August Trce Dr
- 230 Oakwood Dr
- 236 Gaines Trail
- 255 Corbett Dr
- 604 Mitchells Chapel Rd
- 656 Mitchells Chapel Rd
- 670 Mitchells Chapel Rd
- 700 Mitchells Chapel Rd
- 668 Mitchells Chapel Rd
- 670 Mitchell Chapel Rd
- 82 Arthur Alston Rd
- 742 Mitchells Chapel Rd
- 361 Arthur Alston Rd
- 361 Arthur Alston Rd Unit 3
- 635 Mitchells Chapel Rd
- 695 Mitchells Chapel Rd
- 780 Mitchells Chapel Rd
- 769 Mitchells Chapel Rd
- 769 Mitchells Chapel Rd
- 767 Mitchells Chapel Rd
- 834 Mitchells Chapel Rd
- 391 Arthur Alston Rd
- 172 Alston Horton Service Rd
- 382 Alston Horton Service Rd