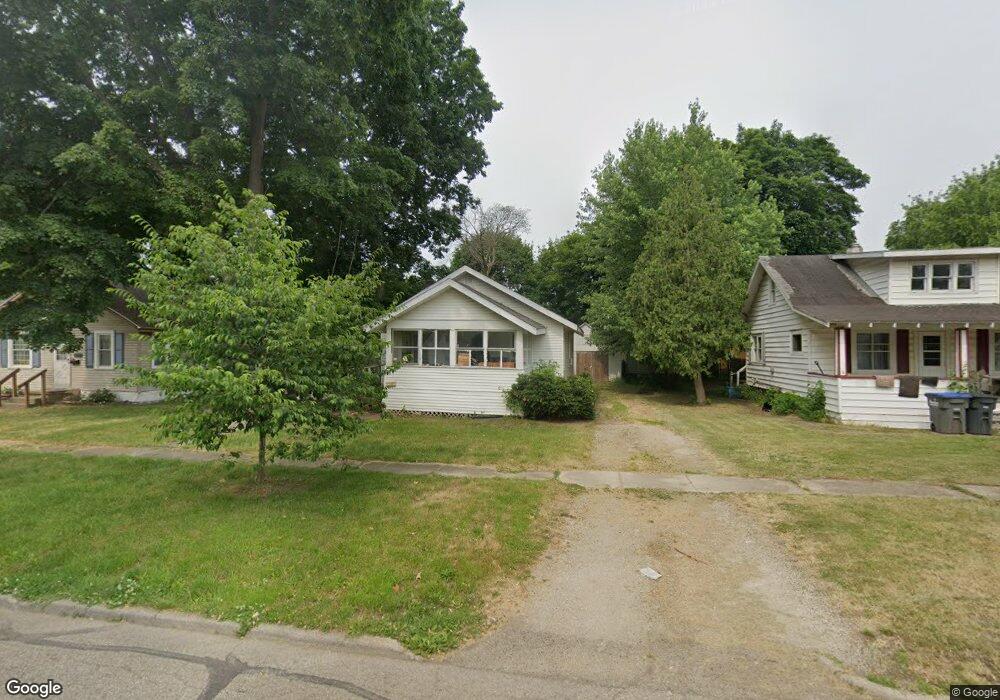
612 N 4th St Sturgis, MI 49091
Estimated Value: $112,000 - $169,000
--
Bed
--
Bath
752
Sq Ft
$178/Sq Ft
Est. Value
About This Home
This home is located at 612 N 4th St, Sturgis, MI 49091 and is currently estimated at $133,828, approximately $177 per square foot. 612 N 4th St is a home located in St. Joseph County with nearby schools including Sturgis High School, Trinity Lutheran School, and St John's Lutheran School.
Ownership History
Date
Name
Owned For
Owner Type
Purchase Details
Closed on
Dec 23, 2004
Sold by
Mortgage Electronic Registration System
Bought by
Household Finance Corp Iii
Current Estimated Value
Purchase Details
Closed on
Oct 9, 2003
Sold by
Stark Ronald
Bought by
Mortgage Electronic Registration In
Purchase Details
Closed on
Jun 2, 2002
Sold by
Hough Douglas Construction
Bought by
Stark Ronald
Purchase Details
Closed on
Jun 2, 2001
Sold by
Hough Construction
Bought by
Stark
Purchase Details
Closed on
Feb 6, 2001
Sold by
Wagaman Kevin and Wagaman Vickie-Ctr
Bought by
Hough Douglas
Purchase Details
Closed on
Feb 2, 2000
Sold by
Hough
Bought by
Wagaman
Purchase Details
Closed on
May 26, 1999
Sold by
Hough Douglas M-Deed
Bought by
Wagama Kevin and Wagama Vickie-Ctr
Purchase Details
Closed on
May 13, 1999
Sold by
Wetzel William R
Bought by
Hough Douglas M
Purchase Details
Closed on
Jan 1, 1901
Create a Home Valuation Report for This Property
The Home Valuation Report is an in-depth analysis detailing your home's value as well as a comparison with similar homes in the area
Home Values in the Area
Average Home Value in this Area
Purchase History
| Date | Buyer | Sale Price | Title Company |
|---|---|---|---|
| Household Finance Corp Iii | -- | Chicago Title Sturgis | |
| Mortgage Electronic Registration In | -- | -- | |
| Stark Ronald | $49,900 | -- | |
| Stark | -- | -- | |
| Hough Douglas | -- | -- | |
| Wagaman | -- | -- | |
| Wagama Kevin | -- | -- | |
| Hough Douglas M | $38,000 | -- | |
| -- | -- | -- |
Source: Public Records
Tax History Compared to Growth
Tax History
| Year | Tax Paid | Tax Assessment Tax Assessment Total Assessment is a certain percentage of the fair market value that is determined by local assessors to be the total taxable value of land and additions on the property. | Land | Improvement |
|---|---|---|---|---|
| 2025 | $1,488 | $49,800 | $4,400 | $45,400 |
| 2024 | $1,312 | $45,600 | $3,900 | $41,700 |
| 2023 | $1,267 | $39,200 | $3,900 | $35,300 |
| 2022 | $1,180 | $33,900 | $3,500 | $30,400 |
| 2021 | $1,326 | $29,800 | $3,400 | $26,400 |
| 2020 | $1,310 | $26,500 | $2,500 | $24,000 |
| 2019 | $1,287 | $23,200 | $3,000 | $20,200 |
| 2018 | $1,185 | $21,800 | $3,700 | $18,100 |
| 2017 | $1,160 | $21,900 | $21,900 | $0 |
| 2016 | -- | $22,200 | $22,200 | $0 |
| 2015 | -- | $20,600 | $0 | $0 |
| 2014 | -- | $18,800 | $18,800 | $0 |
| 2012 | -- | $18,600 | $18,600 | $0 |
Source: Public Records
Map
Nearby Homes
- 607 George St
- 612 N Prospect St
- 610 N Prospect St
- 502 E Jerolene St
- 602 Jean Ave
- 701 N Nottawa St
- 416 Sturgis St
- 607 N Nottawa St
- 402 N 4th St
- 707 E Jerolene St
- 405 Jean St
- 404 Susan Ave
- 814 N Lakeview Ave
- 605 E West St
- 105 Jean St
- 202 N Clay St
- 600 Saint Joseph St
- 1100 Sherwood Forrest Trail
- 218 Michigan Ave
- 302 E Electric Ct