NOT LISTED FOR SALE

612 N Hickory St Jerseyville, IL 62052

Estimated Value: $214,000 - $274,000

3 Beds
2 Baths
1,527 Sq Ft
$156/Sq Ft Est. Value

Last Sold April 11, 2016

Last sale price $156,000 $102 Per Sq Ft

Est. 53% increase in value since last sale

Current estimated payment $1,606/month

About This Home

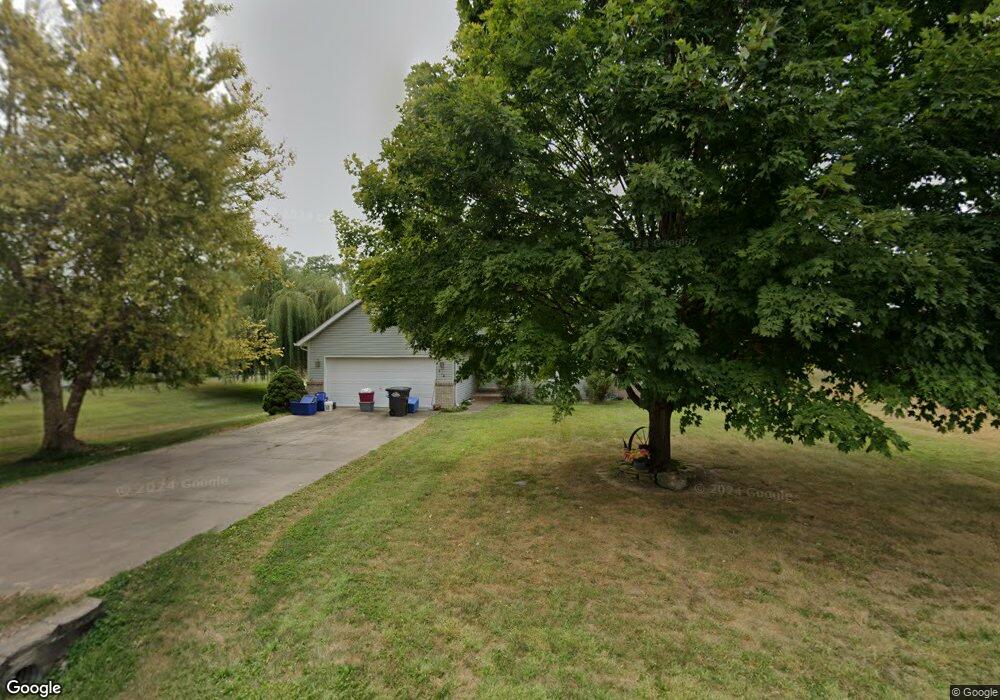
IMMACULATE 3 BEDROOM, 2 BATH HOME ON BIG 104X200 LOT - KITCHEN HAS BEEN UPDATED WITH GRANITE COUNTERS AND CHERRY CABINETS - APPLIANCES ARE STAYING (STOVE, REFRIGERATOR, MICROWAVE, DISHWASHER, WASHER & DRYER) - GAS BURNING FIREPLACE WITH MARBLE HEARTH IN LIVING ROOM - PERGO FLOORING IN LIVING ROOM - MASTER BEDROOM SUITE BATH FEATURES WALK-IN SHOWER - MASTER BEDROOM ALSO FEATURES WALK-IN CLOSET - VAULTED CEILING IN ONE OF THE BEDROOMS - NEWER FURNACE & WATER HEATER - COVERED PATIO WITH CARPETING - BACK YARD BLOOMS WITH BEAUTIFUL PEONIES IN THE SPRING - LANDSCAPING ALSO INCLUDES ROSE BUSHES - SHED

Ownership History

Date Name Owned For Owner Type

Purchase Details

Listed on
Mar 10, 2016
Closed on
Apr 11, 2016
Bought by
Carter Kenneth and Carter Gloria
Seller's Agent
Nancee Gotway
Tarrant and Harman Real Estate and Auction Co
Buyer's Agent
Kim Frazer
Tarrant and Harman Real Estate and Auction Co
List Price
$161,900
Sold Price
$156,000
Premium/Discount to List
-$5,900
-3.64%
Current Estimated Value
$238,492

Home Financials for this Owner

Home Financials are based on the most recent Mortgage that was taken out on this home.
Estimated Appreciation
$82,492
Avg. Annual Appreciation
4.55%
Source: Public Records

Range of Values:

Collateral Analytics

Collateral Analytics Collateral Analytics AVMs (Automated Valuation Model) employ a number of statistical approaches combined with neighborhood-specific comparable selection guarantees the most up-to-date and precise valuations.

Not Available

Collateral Analytics does not have data for the current month. Please view the chart for historical values.

ICE

ICE Mortgage Technology ICE Mortgage Technology’s AVM (Automated Valuation Model) is a state-of-the-art online residential property valuation tool that provides a quick and accurate estimate of the value of almost any home in the U.S.

Not Available

ICE Mortgage Technology does not have data for the current month. Please view the chart for historical values.

First American

First American First American Data & Analytics’ next-generation AVM combines unrivaled data assets with a blended ensemble of valuation models to produce highly accurate, reliable valuations you can trust.

Not Available

First American does not have data for the current month. Please view the chart for historical values.

Quantarium

Quantarium Quantarium’s valuation service, repeatedly proven the industry’s most accurate and comprehensive, is supercharged with a self-learning and auto-tuning AI engine that continually becomes smarter and more accurate as it processes daily inputs from the industry’s leading RE data lake.

Not Available

Quantarium does not have data for the current month. Please view the chart for historical values.

Average Value
Not Available
List Price
Sold Price
Create a Home Valuation Report for This Property
The Home Valuation Report is an in-depth analysis detailing your home's value as well as a comparison with similar homes in the area

Home Values in the Area

Source: Public Records

Average Home Value in this Area


Source: Public Records

Purchase History

Date Buyer Sale Price Title Company
Carter Kenneth $156,000 --
Source: Public Records

Property History

Date Event Price List to Sale Price per Sq Ft Prior Sale
04/11/2016 04/11/16 Sold $156,000 -3.6% $102 / Sq Ft View Prior Sale
03/21/2016 03/21/16 Pending -- -- --
03/10/2016 03/10/16 For Sale $161,900 -- $106 / Sq Ft

Tax History Compared to Growth

Source: Public Records

Tax History

Year Tax Paid Tax Assessment Tax Assessment Total Assessment is a certain percentage of the fair market value that is determined by local assessors to be the total taxable value of land and additions on the property. Land Improvement
2024 $4,184 $60,050 $12,820 $47,230
2023 $2,721 $56,120 $11,980 $44,140
2022 $2,813 $52,445 $11,195 $41,250
2021 $3,652 $49,710 $10,610 $39,100
2020 $2,890 $47,795 $10,200 $37,595
2019 $2,890 $46,630 $9,950 $36,680
2018 $2,820 $46,280 $9,875 $36,405
2017 $2,887 $45,935 $9,800 $36,135
2016 $2,880 $45,255 $9,870 $35,385
2015 -- $45,945 $10,020 $35,925
2014 -- $46,015 $10,035 $35,980
Source: Public Records

Agents Affiliated with this Home

  • Section Image
  • Section Image
See All Agents

Map