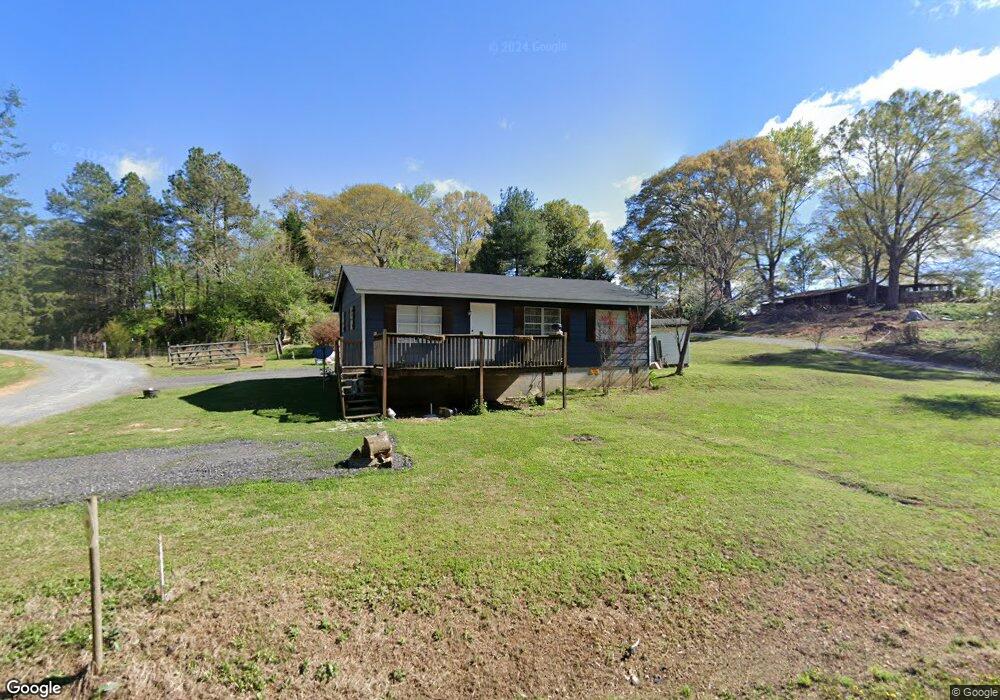
612 Oostanaula Bend Rd SW Calhoun, GA 30701
Estimated Value: $63,000 - $146,000
3
Beds
1
Bath
900
Sq Ft
$117/Sq Ft
Est. Value
About This Home
This home is located at 612 Oostanaula Bend Rd SW, Calhoun, GA 30701 and is currently estimated at $105,011, approximately $116 per square foot. 612 Oostanaula Bend Rd SW is a home located in Gordon County with nearby schools including Swain Elementary School, Ashworth Middle School, and Gordon Central High School.
Ownership History
Date
Name
Owned For
Owner Type
Purchase Details
Closed on
Jan 26, 2023
Sold by
Muse Doris Lee
Bought by
Patterson Misty D
Current Estimated Value
Home Financials for this Owner
Home Financials are based on the most recent Mortgage that was taken out on this home.
Original Mortgage
$68,333
Outstanding Balance
$66,166
Interest Rate
6.27%
Mortgage Type
New Conventional
Estimated Equity
$38,845
Purchase Details
Closed on
Jan 18, 2023
Sold by
Muse Valerie Sharon Risley
Bought by
Paterson Misty D
Home Financials for this Owner
Home Financials are based on the most recent Mortgage that was taken out on this home.
Original Mortgage
$68,333
Outstanding Balance
$66,166
Interest Rate
6.27%
Mortgage Type
New Conventional
Estimated Equity
$38,845
Purchase Details
Closed on
Apr 29, 2016
Sold by
Muse Joshua
Bought by
Muse Doris L
Purchase Details
Closed on
Jan 4, 1991
Bought by
Muse David C
Create a Home Valuation Report for This Property
The Home Valuation Report is an in-depth analysis detailing your home's value as well as a comparison with similar homes in the area
Home Values in the Area
Average Home Value in this Area
Purchase History
| Date | Buyer | Sale Price | Title Company |
|---|---|---|---|
| Patterson Misty D | $62,659 | -- | |
| Paterson Misty D | -- | -- | |
| Muse Doris L | -- | -- | |
| Muse Doris L | -- | -- | |
| Muse Doris L | -- | -- | |
| Muse Doris L | -- | -- | |
| Muse David C | -- | -- |
Source: Public Records
Mortgage History
| Date | Status | Borrower | Loan Amount |
|---|---|---|---|
| Open | Patterson Misty D | $68,333 |
Source: Public Records
Tax History Compared to Growth
Tax History
| Year | Tax Paid | Tax Assessment Tax Assessment Total Assessment is a certain percentage of the fair market value that is determined by local assessors to be the total taxable value of land and additions on the property. | Land | Improvement |
|---|---|---|---|---|
| 2024 | $586 | $31,120 | $680 | $30,440 |
| 2023 | $558 | $21,960 | $520 | $21,440 |
| 2022 | $557 | $20,600 | $520 | $20,080 |
| 2021 | $438 | $15,640 | $520 | $15,120 |
| 2020 | $444 | $15,480 | $520 | $14,960 |
| 2019 | $446 | $15,480 | $520 | $14,960 |
| 2018 | $411 | $14,280 | $520 | $13,760 |
| 2017 | $397 | $13,400 | $520 | $12,880 |
| 2016 | $398 | $13,400 | $520 | $12,880 |
| 2015 | $395 | $13,160 | $520 | $12,640 |
| 2014 | $304 | $12,428 | $556 | $11,871 |
Source: Public Records
Map
Nearby Homes
- 176 Village Way SW
- The Braselton II Plan at Fair Oak
- The Reynolds Plan at Fair Oak
- The Buford II Plan at Fair Oak
- The Lawson Plan at Fair Oak
- The Caldwell Plan at Fair Oak
- The Benson II Plan at Fair Oak
- The Greenbrier II Plan at Fair Oak
- 301 Switch Rd SW
- 413 Beamer Rd SW
- 0 Reeves Station Rd SW Unit 10548197
- 0 Reeves Station Rd SW Unit 7601645
- 130 Brookstone Dr SW
- 210 Madison Dr SW
- 0 Highway 53 Spur SW Unit 7529096
- 1943 Rome Rd SW
- 137 Regency Row SW
- 515 Hunt Bend Rd NW
- 121 Foxhall Dr SW
- 215 Wilson St
- 584 Oostanaula Bend Rd SW
- 744 Oostanaula Bend Rd SW
- 744 Oostanaula Bend Rd SW
- 744 Oostanaula Bend Rd SW
- 178 Oostanaula Bend Rd SW
- 554 Oostanaula Bend Rd SW
- 579 Oostanaula Bend Rd SW
- 424 Oostanaula Bend Rd SW
- 394 Oostanaula Bend Rd SW
- 1245 Oostanaula Bend Rd SW
- 342 Oostanaula Bend Rd SW
- 334 Oostanaula Bend Rd SW
- 324 Oostanaula Bend Rd SW
- 324 Oostanaula
- 318 Oostanaula Bend Rd SW
- 1124 Oostanaula Bend Rd SW
- 1124 Oostanaula Bend Rd SW
- 1250 Oostanaula Bend Rd SW
- 306 Oostanaula Bend Rd SW
- 890 Oostanaula Bend Rd SW