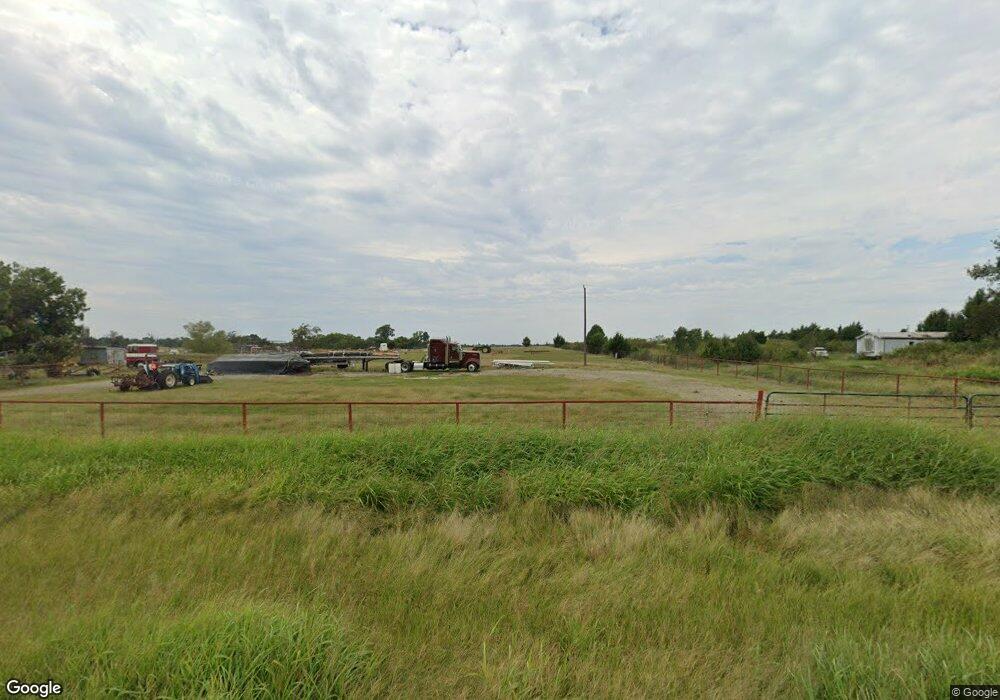
612 S Agra Rd Ripley, OK 74062
Estimated Value: $162,000 - $270,359
3
Beds
1
Bath
1,609
Sq Ft
$142/Sq Ft
Est. Value
About This Home
This home is located at 612 S Agra Rd, Ripley, OK 74062 and is currently estimated at $228,840, approximately $142 per square foot. 612 S Agra Rd is a home located in Payne County with nearby schools including Ripley Elementary School and Ripley High School.
Ownership History
Date
Name
Owned For
Owner Type
Purchase Details
Closed on
Apr 6, 2023
Sold by
Harris Carolyn B
Bought by
Bill L Harris And Carolyn B Harriis Revocable
Current Estimated Value
Purchase Details
Closed on
Aug 24, 2017
Sold by
Grassie Bonnie
Bought by
Grassie James and Grassie Bonnie
Purchase Details
Closed on
Apr 13, 2017
Sold by
Sanchez Abel and Orellana Rosa Elba
Bought by
Alvarenga Lilian N
Purchase Details
Closed on
Nov 7, 2012
Sold by
Taylor Ladonna Kay
Bought by
Orellana Rosa Elba
Home Financials for this Owner
Home Financials are based on the most recent Mortgage that was taken out on this home.
Original Mortgage
$72,000
Interest Rate
3.37%
Mortgage Type
New Conventional
Purchase Details
Closed on
Dec 22, 2008
Sold by
Taylor Kenneth Jay
Bought by
Taylor Ladonna Kay
Create a Home Valuation Report for This Property
The Home Valuation Report is an in-depth analysis detailing your home's value as well as a comparison with similar homes in the area
Home Values in the Area
Average Home Value in this Area
Purchase History
| Date | Buyer | Sale Price | Title Company |
|---|---|---|---|
| Bill L Harris And Carolyn B Harriis Revocable | -- | None Listed On Document | |
| Grassie James | -- | None Available | |
| Alvarenga Lilian N | -- | None Available | |
| Orellana Rosa Elba | $90,000 | None Available | |
| Taylor Ladonna Kay | -- | None Available |
Source: Public Records
Mortgage History
| Date | Status | Borrower | Loan Amount |
|---|---|---|---|
| Previous Owner | Orellana Rosa Elba | $72,000 |
Source: Public Records
Tax History Compared to Growth
Tax History
| Year | Tax Paid | Tax Assessment Tax Assessment Total Assessment is a certain percentage of the fair market value that is determined by local assessors to be the total taxable value of land and additions on the property. | Land | Improvement |
|---|---|---|---|---|
| 2024 | $1,170 | $11,240 | $760 | $10,480 |
| 2023 | $1,170 | $9,745 | $1,992 | $7,753 |
| 2022 | $881 | $8,936 | $2,081 | $6,855 |
| 2021 | $825 | $8,676 | $2,163 | $6,513 |
| 2020 | $809 | $8,423 | $2,397 | $6,026 |
| 2019 | $802 | $8,423 | $2,397 | $6,026 |
| 2018 | $805 | $8,423 | $2,397 | $6,026 |
| 2017 | $826 | $8,423 | $2,397 | $6,026 |
| 2016 | $1,149 | $11,580 | $5,771 | $5,809 |
| 2015 | $1,058 | $11,580 | $5,771 | $5,809 |
| 2014 | $1,033 | $11,580 | $5,771 | $5,809 |
Source: Public Records
Map
Nearby Homes