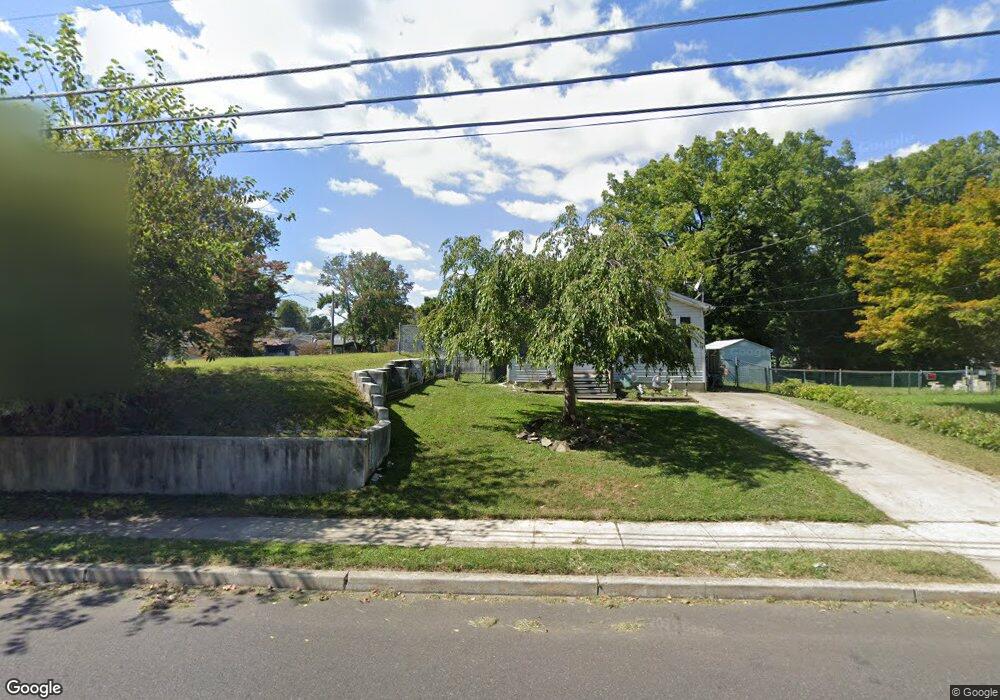
612 Scott Ave Lindenwold, NJ 08021
Estimated Value: $312,982
3
Beds
1
Bath
--
Sq Ft
4,792
Sq Ft Lot
About This Home
This home is located at 612 Scott Ave, Lindenwold, NJ 08021 and is currently estimated at $312,982. 612 Scott Ave is a home located in Camden County with nearby schools including Lindenwold High School, South Jersey Sudbury School, and Trinity Preparatory School Inc..
Ownership History
Date
Name
Owned For
Owner Type
Purchase Details
Closed on
Jan 26, 2006
Sold by
Leather James
Bought by
Demkin Gregory J
Current Estimated Value
Home Financials for this Owner
Home Financials are based on the most recent Mortgage that was taken out on this home.
Original Mortgage
$143,200
Outstanding Balance
$80,950
Interest Rate
6.27%
Estimated Equity
$227,234
Purchase Details
Closed on
Mar 14, 2003
Sold by
Hudson United Bank
Bought by
Leather James
Home Financials for this Owner
Home Financials are based on the most recent Mortgage that was taken out on this home.
Original Mortgage
$50,350
Interest Rate
5.86%
Purchase Details
Closed on
Jan 12, 2001
Sold by
Ewan Iris E
Bought by
Rental Concepts Inc
Home Financials for this Owner
Home Financials are based on the most recent Mortgage that was taken out on this home.
Original Mortgage
$37,500
Interest Rate
7%
Create a Home Valuation Report for This Property
The Home Valuation Report is an in-depth analysis detailing your home's value as well as a comparison with similar homes in the area
Home Values in the Area
Average Home Value in this Area
Purchase History
| Date | Buyer | Sale Price | Title Company |
|---|---|---|---|
| Demkin Gregory J | $179,000 | -- | |
| Leather James | $53,000 | -- | |
| Rental Concepts Inc | $33,750 | -- |
Source: Public Records
Mortgage History
| Date | Status | Borrower | Loan Amount |
|---|---|---|---|
| Open | Demkin Gregory J | $143,200 | |
| Previous Owner | Leather James | $50,350 | |
| Previous Owner | Rental Concepts Inc | $37,500 |
Source: Public Records
Tax History
| Year | Tax Paid | Tax Assessment Tax Assessment Total Assessment is a certain percentage of the fair market value that is determined by local assessors to be the total taxable value of land and additions on the property. | Land | Improvement |
|---|---|---|---|---|
| 2025 | $1,731 | $35,000 | $35,000 | -- |
| 2024 | $1,740 | $35,000 | $35,000 | $0 |
| 2023 | $1,740 | $35,000 | $35,000 | $0 |
| 2022 | $1,738 | $35,000 | $35,000 | $0 |
| 2021 | $1,786 | $35,000 | $35,000 | $0 |
| 2020 | $1,776 | $35,000 | $35,000 | $0 |
| 2019 | $1,792 | $35,000 | $35,000 | $0 |
| 2018 | $1,787 | $35,000 | $35,000 | $0 |
| 2017 | $1,734 | $35,000 | $35,000 | $0 |
| 2016 | $1,695 | $35,000 | $35,000 | $0 |
| 2015 | $1,623 | $35,000 | $35,000 | $0 |
| 2014 | $1,553 | $35,000 | $35,000 | $0 |
Source: Public Records
Map
Nearby Homes
- 330 1st Ave
- 118 1st Ave
- 113 1st Ave
- 113 Lake Blvd
- 315 W Atlantic Ave
- 459 6th Ave
- 225 Chews Landing Rd
- 409 10th Ave
- 334 Chews Landing Rd
- 195 Chews Landing Rd
- 217 W Maple Ave
- 205 State Ave
- 18 Trowbridge Ln Unit BB
- 51 Harwood Ln Unit BB
- 912 Lakeview Ave
- 524 8th Ave
- 514 Park Ave
- 117 State Ave
- 43 Harwood Ln Unit BB
- 1501-1521 Chews Landing Rd
Your Personal Tour Guide
Ask me questions while you tour the home.