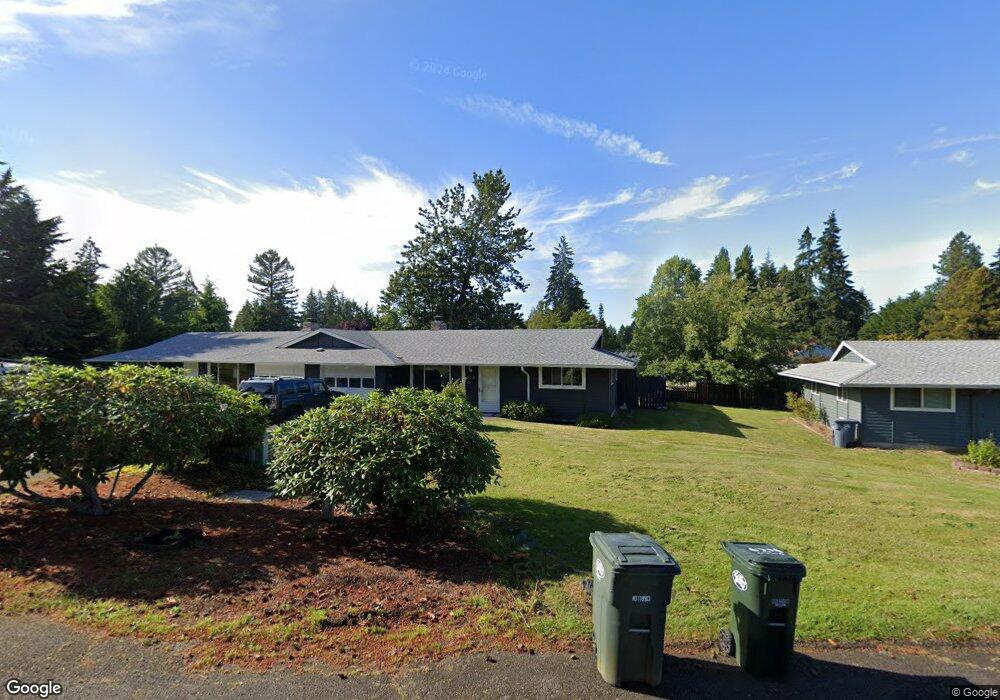
612 Shannon St Unit B612 Steilacoom, WA 98388
Estimated Value: $291,894 - $339,000
2
Beds
1
Bath
828
Sq Ft
$387/Sq Ft
Est. Value
About This Home
This home is located at 612 Shannon St Unit B612, Steilacoom, WA 98388 and is currently estimated at $320,474, approximately $387 per square foot. 612 Shannon St Unit B612 is a home located in Pierce County with nearby schools including Cherrydale Elementary School, Saltars Point Elementary School, and Pioneer Middle School.
Ownership History
Date
Name
Owned For
Owner Type
Purchase Details
Closed on
Sep 21, 2016
Sold by
Wade Adam and Wade Michelle
Bought by
Simmons Robert Allen and Simmons Vicki Lee
Current Estimated Value
Home Financials for this Owner
Home Financials are based on the most recent Mortgage that was taken out on this home.
Original Mortgage
$120,000
Outstanding Balance
$95,851
Interest Rate
3.43%
Mortgage Type
Seller Take Back
Estimated Equity
$224,623
Purchase Details
Closed on
Jul 25, 2000
Sold by
Taylor Lenore
Bought by
Wade Adam G
Home Financials for this Owner
Home Financials are based on the most recent Mortgage that was taken out on this home.
Original Mortgage
$80,250
Interest Rate
8.2%
Purchase Details
Closed on
Jul 14, 2000
Sold by
Wade Uncha
Bought by
Wade Adam G
Home Financials for this Owner
Home Financials are based on the most recent Mortgage that was taken out on this home.
Original Mortgage
$80,250
Interest Rate
8.2%
Create a Home Valuation Report for This Property
The Home Valuation Report is an in-depth analysis detailing your home's value as well as a comparison with similar homes in the area
Home Values in the Area
Average Home Value in this Area
Purchase History
| Date | Buyer | Sale Price | Title Company |
|---|---|---|---|
| Simmons Robert Allen | $119,719 | None Available | |
| Wade Adam G | $98,307 | First American Title Ins Co | |
| Wade Adam G | -- | First American Title Ins Co |
Source: Public Records
Mortgage History
| Date | Status | Borrower | Loan Amount |
|---|---|---|---|
| Open | Simmons Robert Allen | $120,000 | |
| Previous Owner | Wade Adam G | $80,250 |
Source: Public Records
Tax History Compared to Growth
Tax History
| Year | Tax Paid | Tax Assessment Tax Assessment Total Assessment is a certain percentage of the fair market value that is determined by local assessors to be the total taxable value of land and additions on the property. | Land | Improvement |
|---|---|---|---|---|
| 2025 | $2,561 | $324,000 | $223,600 | $100,400 |
| 2024 | $2,561 | $306,200 | $212,000 | $94,200 |
| 2023 | $2,561 | $296,500 | $199,700 | $96,800 |
| 2022 | $2,133 | $295,100 | $199,700 | $95,400 |
| 2021 | $1,968 | $181,900 | $119,400 | $62,500 |
| 2019 | $1,553 | $163,400 | $105,700 | $57,700 |
| 2018 | $1,532 | $139,500 | $83,600 | $55,900 |
| 2017 | $1,339 | $119,900 | $63,900 | $56,000 |
| 2016 | $1,247 | $98,400 | $51,200 | $47,200 |
| 2014 | $1,497 | $96,700 | $51,200 | $45,500 |
| 2013 | $1,497 | $92,100 | $50,300 | $41,800 |
Source: Public Records
Map
Nearby Homes
- 715 Stevens St
- 2514 Shepard St
- 2005 Nisqually St
- 1607 Harrison St
- 214 Cedar St
- 728 Blaine St
- 10802 99th St SW
- 1810 Rainier St
- 1202 Eleanor Ct
- 10014 108th Ave SW
- 2009 Nisqually St
- 2003 Nisqually St
- 2503 Natalie Ln
- 2802 Garden Ct Unit A
- 1514 Rainier St
- 2822 Garden Ct Unit B
- 10411 Mount Tacoma Dr SW
- 1310 Sequalish St
- 2728 Natalie Ln
- 1207 Adams St
- 614 Shannon St Unit B614
- 610 Shannon St Unit A610
- 608 Shannon St
- 2514 Lexington St
- 616 Shannon St Unit C616
- 2516 Lexington St
- 2506 Lexington St
- 618 Shannon St Unit C618
- 0 Lexington St
- 201 Shannon St
- 0 XXX Shannon St
- 611 Galloway St
- 630 Shannon St
- 628 Shannon St
- 615 Galloway St
- 624 Shannon St
- 626 Shannon St
- 2502 Lexington St
- 619 Galloway St
- 622 Shannon St