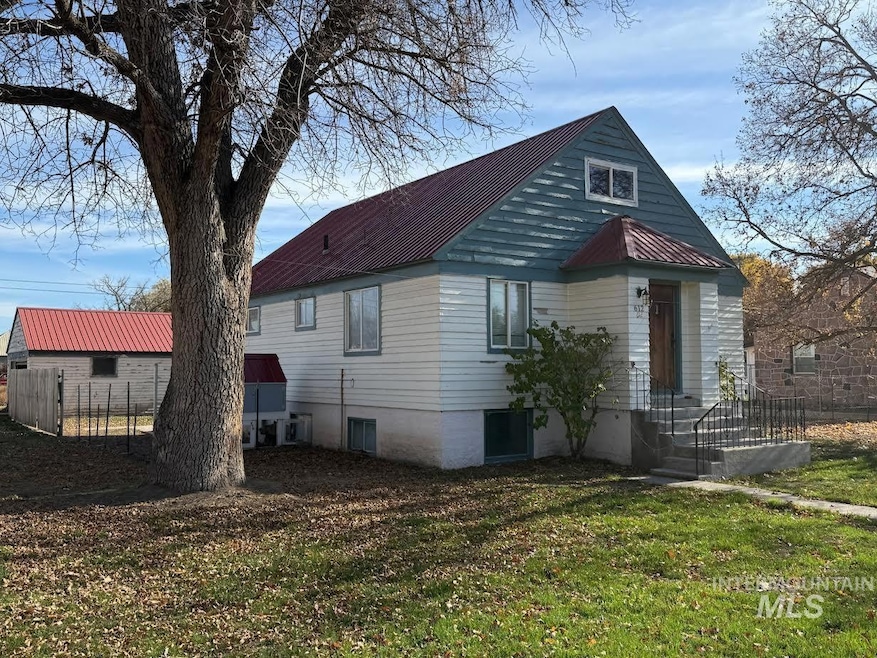
612 SW 3rd St Ontario, OR 97914
Estimated payment $1,672/month
Highlights
- Recreation Room
- Corner Lot
- 2 Car Detached Garage
- Wood Flooring
- Den
- Walk-In Closet
About This Home
Very nice home on a large lot. Has formal living room and dining room, 2 bedrooms on the main level. Roof is approximately ten years old, and the water heater is also about 10 years old. Furnace is about 1 year old. Post holes to finish the fence are already in place and covered with plywood. Natural gas barbeque stays with the house. The chicken coop will be taken by the seller. Door trim is on hand to replace the damaged trim on the left side of upstairs bathroom door. Downstairs contains 1 bedroom and 1 bath, the laundry room and bonus room, as well as area that could be turned into a kitchenette.
Listing Agent
Premier Group Realty West Brokerage Phone: 208-452-5655 Listed on: 11/11/2025
Home Details
Home Type
- Single Family
Est. Annual Taxes
- $2,383
Year Built
- Built in 1938
Lot Details
- 9,017 Sq Ft Lot
- Lot Dimensions are 75x120
- Partially Fenced Property
- Corner Lot
- Manual Sprinklers System
- Garden
Parking
- 2 Car Detached Garage
- Alley Access
Home Design
- Metal Roof
- Wood Siding
Interior Spaces
- 1-Story Property
- Gas Fireplace
- Den
- Recreation Room
- Wood Flooring
- Laundry Room
- Basement
Kitchen
- Oven or Range
- Gas Range
- Microwave
- Dishwasher
- Tile Countertops
- Disposal
Bedrooms and Bathrooms
- 3 Bedrooms | 2 Main Level Bedrooms
- Walk-In Closet
- 2 Bathrooms
Schools
- Alameda Elementary School
- Ontario Jr High Middle School
- Ontario High School
Utilities
- Central Air
- Heating System Uses Natural Gas
- Gas Water Heater
- Cable TV Available
Additional Features
- No or Low VOC Paint or Finish
- Dwelling with Separate Living Area
Listing and Financial Details
- Assessor Parcel Number 18S4709AA
Map
Home Values in the Area
Average Home Value in this Area
Tax History
| Year | Tax Paid | Tax Assessment Tax Assessment Total Assessment is a certain percentage of the fair market value that is determined by local assessors to be the total taxable value of land and additions on the property. | Land | Improvement |
|---|---|---|---|---|
| 2024 | $2,315 | $150,949 | $46,968 | $103,981 |
| 2023 | $2,254 | $146,553 | $37,571 | $108,982 |
| 2022 | $2,193 | $142,285 | $42,248 | $100,037 |
| 2021 | $2,137 | $138,141 | $44,091 | $94,050 |
| 2020 | $2,080 | $134,118 | $42,540 | $91,578 |
| 2019 | $2,025 | $130,212 | $34,505 | $95,707 |
| 2018 | $1,842 | $126,420 | $33,500 | $92,920 |
| 2017 | $1,787 | $122,850 | $33,500 | $89,350 |
| 2016 | $1,776 | $121,500 | $32,750 | $88,750 |
| 2015 | $1,760 | $119,171 | $33,733 | $85,438 |
| 2014 | $1,701 | $115,700 | $32,750 | $82,950 |
Property History
| Date | Event | Price | List to Sale | Price per Sq Ft |
|---|---|---|---|---|
| 11/11/2025 11/11/25 | For Sale | $280,000 | -- | $123 / Sq Ft |
Purchase History
| Date | Type | Sale Price | Title Company |
|---|---|---|---|
| Warranty Deed | $191,000 | Amerititle | |
| Warranty Deed | $111,000 | -- |
Mortgage History
| Date | Status | Loan Amount | Loan Type |
|---|---|---|---|
| Open | $152,800 | New Conventional | |
| Previous Owner | $88,800 | New Conventional |
Source: Intermountain MLS
MLS Number: 98967202
APN: 2178
Disclaimer: Certain information contained herein is derived from information provided by parties other than Homes.com. All information provided is deemed reliable, but is not guaranteed to be accurate and should be independently verified.
![]() IDX information is provided exclusively for consumers’ personal, non-commercial use, that it may not be used for any purpose other than to identify prospective properties consumers may be interested in purchasing. IMLS does not assume any liability for missing or inaccurate data.
IDX information is provided exclusively for consumers’ personal, non-commercial use, that it may not be used for any purpose other than to identify prospective properties consumers may be interested in purchasing. IMLS does not assume any liability for missing or inaccurate data.
Information provided by IMLS is deemed reliable but not guaranteed.
- 787 SW 3rd St
- 191 SW 5th Ave
- 610 SW 5th St
- 285 SW 3rd St
- 264 SW 10th Ave
- 287 SW 6th St Units 1&2
- TBD Kimball Rd
- 297 SW 6th St Units 1&2
- 3 lots at Corner of Se 6th Ave & Se 1st St
- 107 SE 5th Ave
- 161 SE 5th Ave
- 585 S Park Blvd
- 235 W Idaho Ave
- 82 NW 3rd St
- TBD SE 3rd St & 7th Ave
- 0 Kimball Rd
- 161 SW 9th St
- 1135 SW 9th Ave
- 99 NW 9th St
- 146 NW 9th St
- 1133 Fortner St
- 420 Murray Ave
- 23426 Old Hwy 30
- 1506 Rochester St Unit 102
- 605 E Elgin St
- 616 Main St
- 1508 Hope Ln
- 2507 Orogrande Ln
- 9380 Ruth Marie Dr
- 116 S Kcid Rd
- 11755 Altamont St
- 11549 Roanoke Dr
- 1104 N Deerhaven Way
- 12349 W Norterra Ln
- 3095 N Picton Ave
- 12267 W Endsley Ln
- 362 N Lagrasse Ln
- 350 N Lagrasse Ln
- 55 S Selwood Ln
- 9432 W Barcelona St
