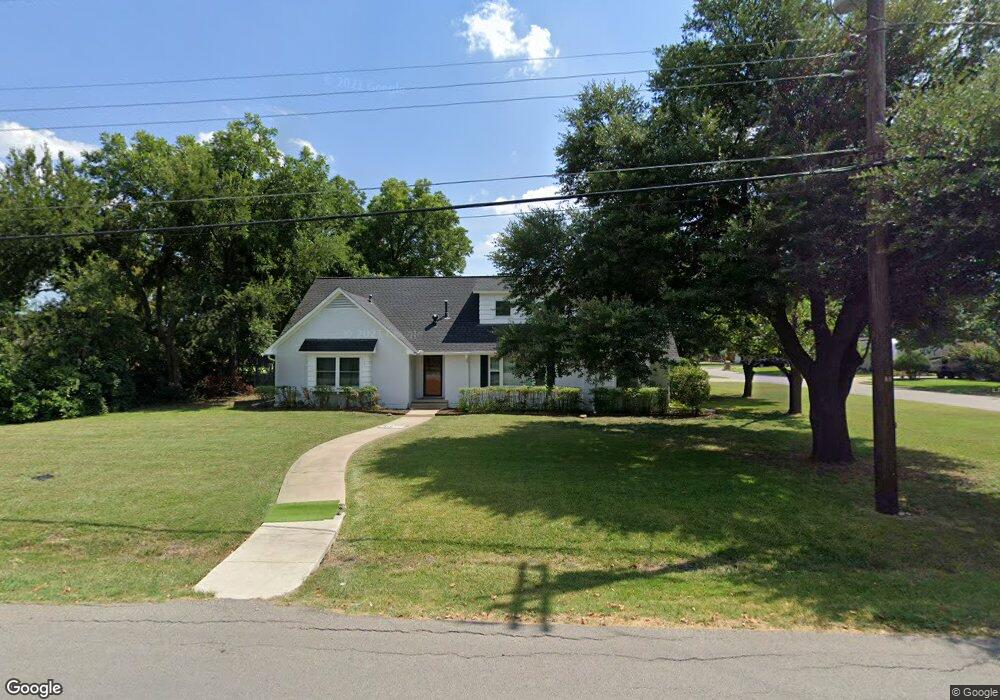
612 W Ash St Celina, TX 75009
Estimated Value: $521,537 - $598,000
4
Beds
3
Baths
2,784
Sq Ft
$202/Sq Ft
Est. Value
About This Home
This home is located at 612 W Ash St, Celina, TX 75009 and is currently estimated at $561,134, approximately $201 per square foot. 612 W Ash St is a home located in Collin County with nearby schools including Celina Primary School, Marcy B. Lykins Elementary School, and Moore Middle School.
Ownership History
Date
Name
Owned For
Owner Type
Purchase Details
Closed on
Nov 3, 2008
Sold by
Vitz William
Bought by
Vitz Charles A and Vitz Wendy E
Current Estimated Value
Purchase Details
Closed on
Sep 20, 2006
Sold by
The First Methodist Church Of Celina
Bought by
Vitz William
Home Financials for this Owner
Home Financials are based on the most recent Mortgage that was taken out on this home.
Original Mortgage
$111,700
Interest Rate
7.12%
Mortgage Type
Purchase Money Mortgage
Create a Home Valuation Report for This Property
The Home Valuation Report is an in-depth analysis detailing your home's value as well as a comparison with similar homes in the area
Home Values in the Area
Average Home Value in this Area
Purchase History
| Date | Buyer | Sale Price | Title Company |
|---|---|---|---|
| Vitz Charles A | -- | None Available | |
| Vitz William | -- | Stnt |
Source: Public Records
Mortgage History
| Date | Status | Borrower | Loan Amount |
|---|---|---|---|
| Previous Owner | Vitz William | $111,700 |
Source: Public Records
Tax History Compared to Growth
Tax History
| Year | Tax Paid | Tax Assessment Tax Assessment Total Assessment is a certain percentage of the fair market value that is determined by local assessors to be the total taxable value of land and additions on the property. | Land | Improvement |
|---|---|---|---|---|
| 2025 | $5,545 | $367,424 | $207,000 | $329,284 |
| 2024 | $5,545 | $334,022 | $172,500 | $314,424 |
| 2023 | $5,545 | $303,656 | $138,000 | $374,000 |
| 2022 | $6,327 | $276,051 | $80,000 | $476,022 |
| 2021 | $5,860 | $392,935 | $40,000 | $352,935 |
| 2020 | $5,590 | $372,989 | $40,000 | $332,989 |
| 2019 | $5,752 | $225,818 | $40,000 | $185,818 |
| 2018 | $4,821 | $188,546 | $25,000 | $163,546 |
| 2017 | $5,181 | $202,610 | $25,000 | $177,610 |
| 2016 | $4,844 | $188,146 | $25,000 | $163,146 |
| 2015 | $3,484 | $158,057 | $25,000 | $133,057 |
Source: Public Records
Map
Nearby Homes