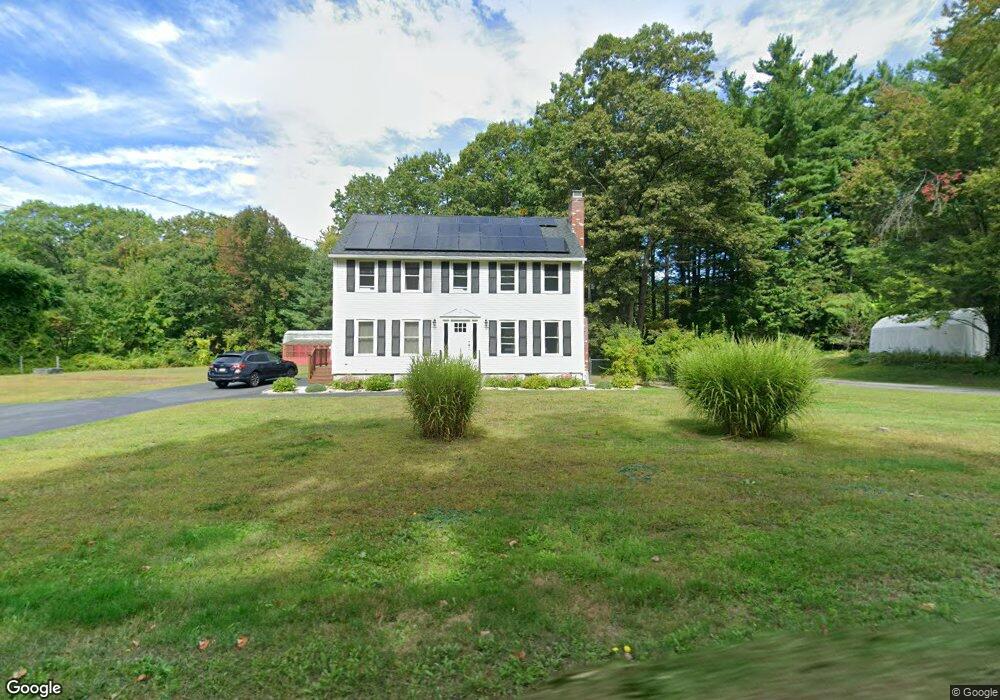
612 West St Lunenburg, MA 01462
Estimated Value: $421,000 - $449,307
3
Beds
1
Bath
1,008
Sq Ft
$431/Sq Ft
Est. Value
About This Home
This home is located at 612 West St, Lunenburg, MA 01462 and is currently estimated at $434,077, approximately $430 per square foot. 612 West St is a home located in Worcester County with nearby schools including Lunenburg Primary School, Lunenburg High School, and St Bernards Elementary School.
Ownership History
Date
Name
Owned For
Owner Type
Purchase Details
Closed on
Sep 27, 1996
Sold by
Benjamin Bldrs Rt and Lorden Gary
Bought by
Laperle William G and Kavanaugh Mary
Current Estimated Value
Home Financials for this Owner
Home Financials are based on the most recent Mortgage that was taken out on this home.
Original Mortgage
$80,000
Interest Rate
7.83%
Mortgage Type
Purchase Money Mortgage
Purchase Details
Closed on
Mar 14, 1994
Sold by
Shirley Coop Bank
Bought by
Bertozzi Ralph
Purchase Details
Closed on
Sep 30, 1993
Sold by
Northern Financial Ser
Bought by
Shirley Coop Bank
Purchase Details
Closed on
Aug 24, 1992
Sold by
Healey Elizabeth A
Bought by
Bertozzi Ralph
Home Financials for this Owner
Home Financials are based on the most recent Mortgage that was taken out on this home.
Original Mortgage
$35,000
Interest Rate
8.12%
Mortgage Type
Purchase Money Mortgage
Create a Home Valuation Report for This Property
The Home Valuation Report is an in-depth analysis detailing your home's value as well as a comparison with similar homes in the area
Home Values in the Area
Average Home Value in this Area
Purchase History
| Date | Buyer | Sale Price | Title Company |
|---|---|---|---|
| Laperle William G | $121,770 | -- | |
| Bertozzi Ralph | $33,333 | -- | |
| Shirley Coop Bank | $48,000 | -- | |
| Bertozzi Ralph | $35,000 | -- |
Source: Public Records
Mortgage History
| Date | Status | Borrower | Loan Amount |
|---|---|---|---|
| Open | Bertozzi Ralph | $93,000 | |
| Closed | Bertozzi Ralph | $6,000 | |
| Closed | Bertozzi Ralph | $80,000 | |
| Previous Owner | Bertozzi Ralph | $35,000 |
Source: Public Records
Tax History Compared to Growth
Tax History
| Year | Tax Paid | Tax Assessment Tax Assessment Total Assessment is a certain percentage of the fair market value that is determined by local assessors to be the total taxable value of land and additions on the property. | Land | Improvement |
|---|---|---|---|---|
| 2025 | $5,951 | $414,400 | $160,700 | $253,700 |
| 2024 | $5,526 | $391,900 | $151,900 | $240,000 |
| 2023 | $5,401 | $369,400 | $137,800 | $231,600 |
| 2022 | $5,023 | $292,200 | $115,400 | $176,800 |
| 2020 | $4,842 | $267,200 | $115,400 | $151,800 |
| 2019 | $4,651 | $249,000 | $109,000 | $140,000 |
| 2018 | $4,318 | $219,200 | $105,400 | $113,800 |
| 2017 | $4,180 | $209,200 | $101,200 | $108,000 |
| 2016 | $3,967 | $202,300 | $96,800 | $105,500 |
| 2015 | $3,574 | $195,100 | $92,400 | $102,700 |
Source: Public Records
Map
Nearby Homes