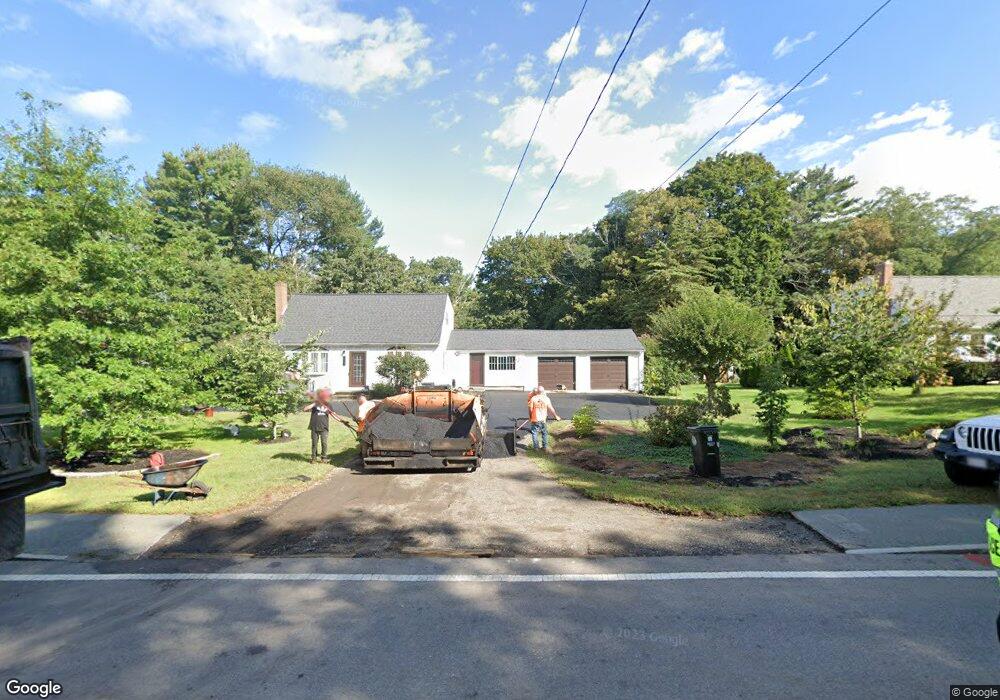
612 West St Wrentham, MA 02093
Sheldonville NeighborhoodEstimated Value: $527,000 - $649,000
3
Beds
1
Bath
1,344
Sq Ft
$433/Sq Ft
Est. Value
About This Home
This home is located at 612 West St, Wrentham, MA 02093 and is currently estimated at $582,025, approximately $433 per square foot. 612 West St is a home located in Norfolk County with nearby schools including Delaney Elementary School, Charles E Roderick, and Mercymount Country Day School.
Ownership History
Date
Name
Owned For
Owner Type
Purchase Details
Closed on
Jun 30, 1997
Sold by
Sorjanen Robert
Bought by
Chota Sharon K
Current Estimated Value
Create a Home Valuation Report for This Property
The Home Valuation Report is an in-depth analysis detailing your home's value as well as a comparison with similar homes in the area
Home Values in the Area
Average Home Value in this Area
Purchase History
| Date | Buyer | Sale Price | Title Company |
|---|---|---|---|
| Chota Sharon K | $125,000 | -- |
Source: Public Records
Mortgage History
| Date | Status | Borrower | Loan Amount |
|---|---|---|---|
| Open | Chota Sharon K | $168,000 | |
| Closed | Chota Sharon K | $187,000 | |
| Closed | Chota Sharon K | $126,000 |
Source: Public Records
Tax History
| Year | Tax Paid | Tax Assessment Tax Assessment Total Assessment is a certain percentage of the fair market value that is determined by local assessors to be the total taxable value of land and additions on the property. | Land | Improvement |
|---|---|---|---|---|
| 2025 | $5,899 | $509,000 | $254,300 | $254,700 |
| 2024 | $5,696 | $474,700 | $254,300 | $220,400 |
| 2023 | $5,457 | $432,400 | $231,200 | $201,200 |
| 2022 | $5,349 | $391,300 | $225,000 | $166,300 |
| 2021 | $5,179 | $368,100 | $210,200 | $157,900 |
| 2020 | $4,618 | $324,100 | $160,500 | $163,600 |
| 2019 | $4,232 | $299,700 | $144,400 | $155,300 |
| 2018 | $4,208 | $295,500 | $144,600 | $150,900 |
| 2017 | $3,969 | $278,500 | $141,800 | $136,700 |
| 2016 | $3,881 | $271,800 | $137,700 | $134,100 |
| 2015 | $3,968 | $264,900 | $147,100 | $117,800 |
| 2014 | $3,924 | $256,300 | $141,500 | $114,800 |
Source: Public Records
Map
Nearby Homes
- 613 West St
- 440 Chestnut St
- 20 Field Cir
- 955 Summer St
- 19 Chestnut Lot 0
- 1222 South St
- 11 Amber Dr
- 18 Huntington Ave
- 0 Berry St
- Lot 1 - Blueberry 2 Car Plan at King Philip Estates
- Lot 8 - Blueberry 2 Car Plan at King Philip Estates
- Lot 5 - Hughes 2 car Plan at King Philip Estates
- Lot 6 - Blueberry 3 Car Plan at King Philip Estates
- 10 Earle Stewart Ln Unit Lot 5
- Lot 2 - Camden 2 Car Plan at King Philip Estates
- Lot 7 - Cedar Plan at King Philip Estates
- Lot 4 - Hemingway 2 Car Plan at King Philip Estates
- 14 Earle Stewart Ln
- Lot 3 - Blueberry 2 Car Plan at King Philip Estates
- 12 Earle Stewart Ln
Your Personal Tour Guide
Ask me questions while you tour the home.