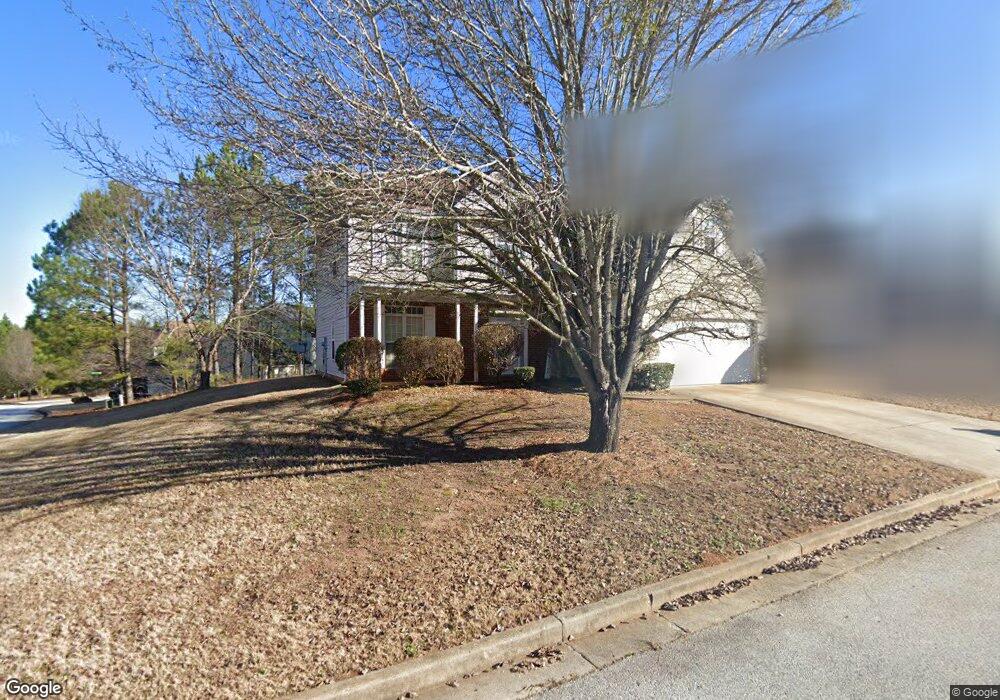
6120 Course Side Way Unit Way Lithonia, GA 30058
Estimated Value: $295,000 - $341,000
4
Beds
3
Baths
2,328
Sq Ft
$134/Sq Ft
Est. Value
About This Home
This home is located at 6120 Course Side Way Unit Way, Lithonia, GA 30058 and is currently estimated at $312,308, approximately $134 per square foot. 6120 Course Side Way Unit Way is a home located in DeKalb County with nearby schools including Shadow Rock Elementary School, Redan Middle School, and Redan High School.
Ownership History
Date
Name
Owned For
Owner Type
Purchase Details
Closed on
Jan 3, 2023
Sold by
Stefanetti Llc
Bought by
Towns Tullock Patricia
Current Estimated Value
Home Financials for this Owner
Home Financials are based on the most recent Mortgage that was taken out on this home.
Original Mortgage
$304,385
Outstanding Balance
$294,237
Interest Rate
6.37%
Mortgage Type
FHA
Estimated Equity
$18,072
Purchase Details
Closed on
Nov 8, 2011
Sold by
Select American Homes Llc
Bought by
Stefanetti
Purchase Details
Closed on
May 4, 2010
Sold by
Wells Fargo Bk Na
Bought by
Hud-Housing Of Urban Dev
Purchase Details
Closed on
Jan 30, 2002
Sold by
Homeland Legacy Inc
Bought by
Edwards Raquel
Home Financials for this Owner
Home Financials are based on the most recent Mortgage that was taken out on this home.
Original Mortgage
$167,456
Interest Rate
7.16%
Mortgage Type
New Conventional
Create a Home Valuation Report for This Property
The Home Valuation Report is an in-depth analysis detailing your home's value as well as a comparison with similar homes in the area
Home Values in the Area
Average Home Value in this Area
Purchase History
| Date | Buyer | Sale Price | Title Company |
|---|---|---|---|
| Towns Tullock Patricia | $310,000 | -- | |
| Stefanetti | $34,220 | -- | |
| Select American Homes Llc | $34,220 | -- | |
| Hud-Housing Of Urban Dev | -- | -- | |
| Wells Fargo Bk Na | $167,022 | -- | |
| Edwards Raquel | $170,100 | -- |
Source: Public Records
Mortgage History
| Date | Status | Borrower | Loan Amount |
|---|---|---|---|
| Open | Towns Tullock Patricia | $304,385 | |
| Previous Owner | Edwards Raquel | $167,456 |
Source: Public Records
Tax History Compared to Growth
Tax History
| Year | Tax Paid | Tax Assessment Tax Assessment Total Assessment is a certain percentage of the fair market value that is determined by local assessors to be the total taxable value of land and additions on the property. | Land | Improvement |
|---|---|---|---|---|
| 2025 | $3,888 | $122,200 | $12,000 | $110,200 |
| 2024 | $4,100 | $124,000 | $11,880 | $112,120 |
| 2023 | $4,100 | $113,760 | $12,000 | $101,760 |
| 2022 | $4,746 | $101,000 | $10,000 | $91,000 |
| 2021 | $3,740 | $78,080 | $10,000 | $68,080 |
| 2020 | $3,357 | $69,360 | $10,000 | $59,360 |
| 2019 | $3,192 | $65,600 | $10,000 | $55,600 |
| 2018 | $2,587 | $57,440 | $6,200 | $51,240 |
| 2017 | $2,773 | $55,800 | $6,200 | $49,600 |
| 2016 | $2,646 | $52,800 | $6,200 | $46,600 |
| 2014 | $934 | $13,720 | $6,200 | $7,520 |
Source: Public Records
Map
Nearby Homes
- 1055 Carriage Place
- 6020 Paul Rd
- 6019 Paul Rd
- 663 Lakes Cir
- 607 Shadow Valley Ct
- 1062 Valley Rock Dr
- 6393 Shadow Square
- 6373 Shadow Square
- 6220 Pattillo Way
- 6261 Lake Valley Point
- 978 Shadow Ridge Trail
- 579 Shadow Lake Dr
- 6212 Lake Valley Point
- 6256 Lake Valley Point
- 491 Shadow Valley Ct
- 6274 Booker Ln
- 6280 Lake Valley Point
- 6150 Silver Spur Dr
- 6247 Greenock Dr Unit 5
- 1075 Falkirk Ln
- 6120 Course Side Way
- 6126 Course Side Way
- 6123 Howell Ridge
- 6127 Howell Ridge
- 5992 Shadow Lake Way
- 5984 Shadow Lake Way
- 6134 Course Side Way
- 6121 Course Side Way
- 5978 Shadow Lake Way
- 5998 Shadow Lake Way
- 6135 Howell Ridge
- 6129 Course Side Way
- 5967 Shadow Lake Way
- 6133 Course Side Way
- 6006 Shadow Lake Way
- 5974 Shadow Lake Way
- 6144 Course Side Way
- 6128 Howell Ridge
- 6059 Shadow Lakes Way
- 6143 Howell Ridge