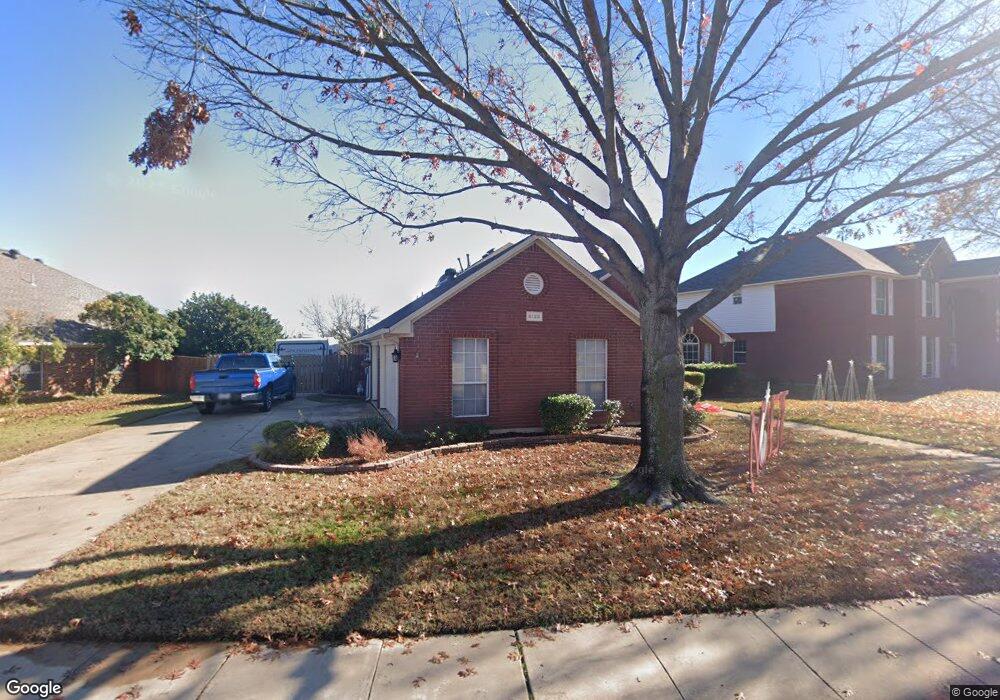
6120 Roaring Springs Dr North Richland Hills, TX 76180
Estimated Value: $493,000 - $518,000
4
Beds
2
Baths
2,548
Sq Ft
$200/Sq Ft
Est. Value
About This Home
This home is located at 6120 Roaring Springs Dr, North Richland Hills, TX 76180 and is currently estimated at $509,882, approximately $200 per square foot. 6120 Roaring Springs Dr is a home located in Tarrant County with nearby schools including Walker Creek Elementary School, Smithfield Middle School, and Birdville High School.
Ownership History
Date
Name
Owned For
Owner Type
Purchase Details
Closed on
Sep 25, 2015
Sold by
Clifton Laurel and Clifton Jeffrey Jake
Bought by
Bruner Jay K and Bruner Regina D
Current Estimated Value
Home Financials for this Owner
Home Financials are based on the most recent Mortgage that was taken out on this home.
Original Mortgage
$205,275
Outstanding Balance
$162,000
Interest Rate
3.97%
Mortgage Type
New Conventional
Estimated Equity
$347,882
Purchase Details
Closed on
Aug 28, 1996
Sold by
D R Horton Texas Ltd
Bought by
Moorhead Charles W and Moorhead Zenith L
Home Financials for this Owner
Home Financials are based on the most recent Mortgage that was taken out on this home.
Original Mortgage
$163,200
Interest Rate
8.27%
Mortgage Type
VA
Purchase Details
Closed on
May 30, 1996
Sold by
Spring Oaks Development Corp
Bought by
D R Horton Texas Ltd
Create a Home Valuation Report for This Property
The Home Valuation Report is an in-depth analysis detailing your home's value as well as a comparison with similar homes in the area
Home Values in the Area
Average Home Value in this Area
Purchase History
| Date | Buyer | Sale Price | Title Company |
|---|---|---|---|
| Bruner Jay K | -- | Attorney | |
| Moorhead Charles W | -- | Drh Title Co | |
| D R Horton Texas Ltd | -- | D R H Title Co |
Source: Public Records
Mortgage History
| Date | Status | Borrower | Loan Amount |
|---|---|---|---|
| Open | Bruner Jay K | $205,275 | |
| Previous Owner | Moorhead Charles W | $163,200 |
Source: Public Records
Tax History Compared to Growth
Tax History
| Year | Tax Paid | Tax Assessment Tax Assessment Total Assessment is a certain percentage of the fair market value that is determined by local assessors to be the total taxable value of land and additions on the property. | Land | Improvement |
|---|---|---|---|---|
| 2025 | $8,043 | $462,808 | $75,000 | $387,808 |
| 2024 | $8,043 | $462,808 | $75,000 | $387,808 |
| 2023 | $9,264 | $508,440 | $75,000 | $433,440 |
| 2022 | $9,238 | $417,495 | $60,000 | $357,495 |
| 2021 | $8,881 | $348,996 | $60,000 | $288,996 |
| 2020 | $8,880 | $355,345 | $60,000 | $295,345 |
| 2019 | $8,355 | $339,074 | $60,000 | $279,074 |
| 2018 | $6,979 | $288,426 | $60,000 | $228,426 |
| 2017 | $7,573 | $281,454 | $60,000 | $221,454 |
| 2016 | $7,406 | $275,275 | $35,000 | $240,275 |
| 2015 | $4,732 | $217,000 | $34,000 | $183,000 |
| 2014 | $4,732 | $217,000 | $34,000 | $183,000 |
Source: Public Records
Map
Nearby Homes
- 6113 Cliffbrook Dr
- 6250 Shirley Dr
- 8240 Bridge St
- 6017 Avalon St
- 8321 Bridge St
- 8057 Caladium Dr
- 8020 Bridge St
- 7800 Mockingbird Ln Unit 29
- 7800 Mockingbird Ln Unit 81
- 7800 Mockingbird Ln Unit 73
- 7800 Mockingbird Ln Unit 43
- 7800 Mockingbird Ln Unit 205
- 5920 Pedernales Ridge
- 0 Mid Cities Blvd
- 6137 Marquita Mews
- 6116 Morningside Dr
- 8740 Ice House Dr
- 8748 Morris Mews
- 6008 Monterey Mews
- 8765 Bridge St
- 6124 Roaring Springs Dr
- 6116 Roaring Springs Dr
- 6117 Cliffbrook Dr
- 6112 Roaring Springs Dr
- 6200 Roaring Springs Dr
- 6121 Cliffbrook Dr
- 6125 Roaring Springs Dr
- 6129 Roaring Springs Dr
- 6121 Roaring Springs Dr
- 6117 Roaring Springs Dr
- 6108 Roaring Springs Dr
- 6204 Roaring Springs Dr
- 6125 Cliffbrook Dr
- 6113 Roaring Springs Dr
- 6109 Cliffbrook Dr
- 6201 Roaring Springs Dr
- 6109 Roaring Springs Dr
- 6104 Roaring Springs Dr
- 6208 Roaring Springs Dr
- 6129 Cliffbrook Dr