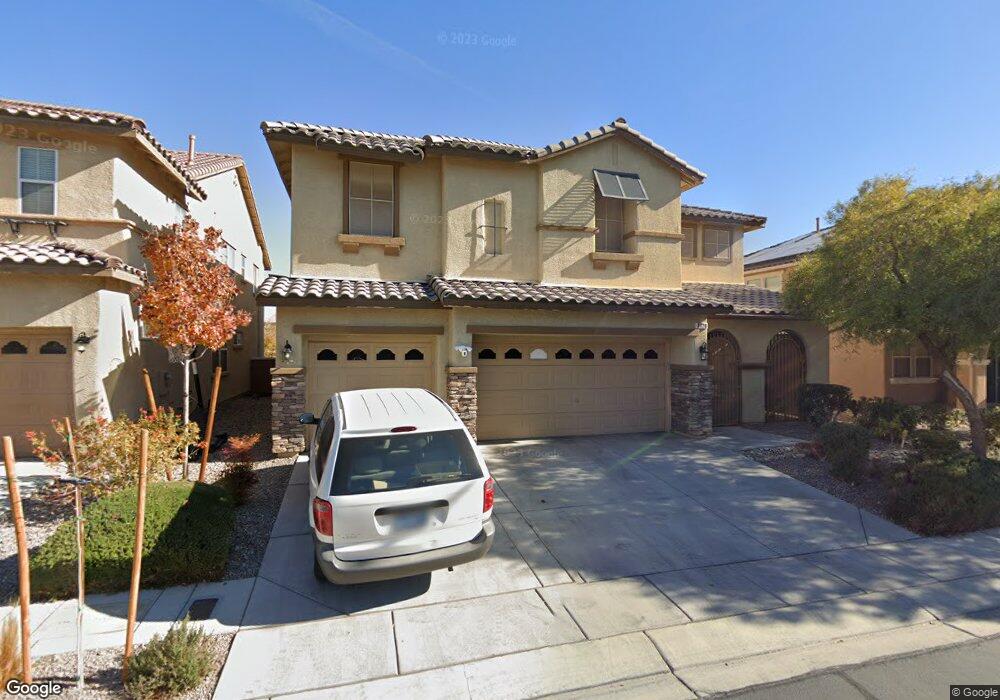
6120 Silken Saddle St North Las Vegas, NV 89031
Craig Ranch NeighborhoodEstimated Value: $557,941 - $591,000
5
Beds
3
Baths
3,309
Sq Ft
$175/Sq Ft
Est. Value
About This Home
This home is located at 6120 Silken Saddle St, North Las Vegas, NV 89031 and is currently estimated at $577,485, approximately $174 per square foot. 6120 Silken Saddle St is a home located in Clark County with nearby schools including Fredric W. Watson Elementary School, Clifford O. Findlay Middle School, and Legacy High School.
Ownership History
Date
Name
Owned For
Owner Type
Purchase Details
Closed on
Aug 6, 2007
Sold by
Rock John O and Rock Audrey M
Bought by
Rock Donald W and Rock Marissa M
Current Estimated Value
Purchase Details
Closed on
Mar 5, 2007
Sold by
Rock John O and Rock Audrey M
Bought by
Rock John O and Rock Audrey M
Home Financials for this Owner
Home Financials are based on the most recent Mortgage that was taken out on this home.
Original Mortgage
$322,092
Outstanding Balance
$187,511
Interest Rate
5.75%
Mortgage Type
Unknown
Estimated Equity
$389,974
Purchase Details
Closed on
Jan 22, 2007
Sold by
Kb Home Nevada Inc
Bought by
Rock Donald W and Rock Marissa M
Home Financials for this Owner
Home Financials are based on the most recent Mortgage that was taken out on this home.
Original Mortgage
$322,092
Outstanding Balance
$187,511
Interest Rate
5.75%
Mortgage Type
Unknown
Estimated Equity
$389,974
Purchase Details
Closed on
Feb 21, 2006
Sold by
Hearthstone Multi Asset Entity B Lp
Bought by
Kb Home Nevada Inc
Create a Home Valuation Report for This Property
The Home Valuation Report is an in-depth analysis detailing your home's value as well as a comparison with similar homes in the area
Home Values in the Area
Average Home Value in this Area
Purchase History
| Date | Buyer | Sale Price | Title Company |
|---|---|---|---|
| Rock Donald W | -- | None Available | |
| Rock John O | -- | None Available | |
| Rock Donald W | $402,615 | First Amer Title Co Of Nv | |
| Kb Home Nevada Inc | $2,805,808 | First Amer Title Co Of Nv |
Source: Public Records
Mortgage History
| Date | Status | Borrower | Loan Amount |
|---|---|---|---|
| Open | Rock Donald W | $322,092 |
Source: Public Records
Tax History Compared to Growth
Tax History
| Year | Tax Paid | Tax Assessment Tax Assessment Total Assessment is a certain percentage of the fair market value that is determined by local assessors to be the total taxable value of land and additions on the property. | Land | Improvement |
|---|---|---|---|---|
| 2025 | $2,698 | $184,290 | $40,600 | $143,690 |
| 2024 | $2,620 | $184,290 | $40,600 | $143,690 |
| 2023 | $2,620 | $178,786 | $37,800 | $140,986 |
| 2022 | $2,544 | $161,998 | $33,600 | $128,398 |
| 2021 | $2,470 | $128,526 | $29,750 | $98,776 |
| 2020 | $2,395 | $128,075 | $28,000 | $100,075 |
| 2019 | $2,325 | $122,949 | $24,500 | $98,449 |
| 2018 | $2,257 | $108,717 | $20,300 | $88,417 |
| 2017 | $3,366 | $100,272 | $19,950 | $80,322 |
| 2016 | $2,138 | $84,212 | $16,100 | $68,112 |
| 2015 | $2,133 | $62,710 | $11,900 | $50,810 |
| 2014 | $2,071 | $59,823 | $8,750 | $51,073 |
Source: Public Records
Map
Nearby Homes
- 6084 Silken Saddle St
- 6030 Hidden Summit St
- 6219 Mangler St Unit 1
- 213 Vegas Verde Ave Unit LOT 25
- 221 Vegas Verde Ave Unit 27
- 47 Barton Bay Ave
- 220 Vegas Verde Ave
- 220 Vegas Verde Ave Unit LOT 4
- 320 Gemstone Hill Ave
- 217 Delighted Ave
- 104 Barton Bay Ave
- 2436 Plan at Sky Falls
- 2660 Plan at Sky Falls
- 2160 Plan at Sky Falls
- 3000 Plan at Sky Falls
- 117 Barton Bay Ave
- Paxton Plan at Heritage Square
- Alina Plan at Heritage Square
- Nadia Plan at Heritage Square
- 228 Vegas Verde Ave Unit LOT 2
- 6124 Silken Saddle St
- 6116 Silken Saddle St
- 4 Summit Creek Ave
- 6128 Silken Saddle St
- 6113 Silken Saddle St
- 9 Junction Peak Ave Unit 1
- 6108 Silken Saddle St Unit 1
- 6149 Sapphire Gold St
- 6153 Sapphire Gold St
- 6153 Sapphire Gold St Unit None
- 6145 Sapphire Gold St
- 4 Junction Peak Ave Unit 1
- 6109 Silken Saddle St
- 6157 Sapphire Gold St
- 6157 Sapphire Gold St Unit n/a
- 6104 Silken Saddle St
- 13 Junction Peak Ave
- 12 Summit Creek Ave Unit 1
- 8 Junction Peak Ave