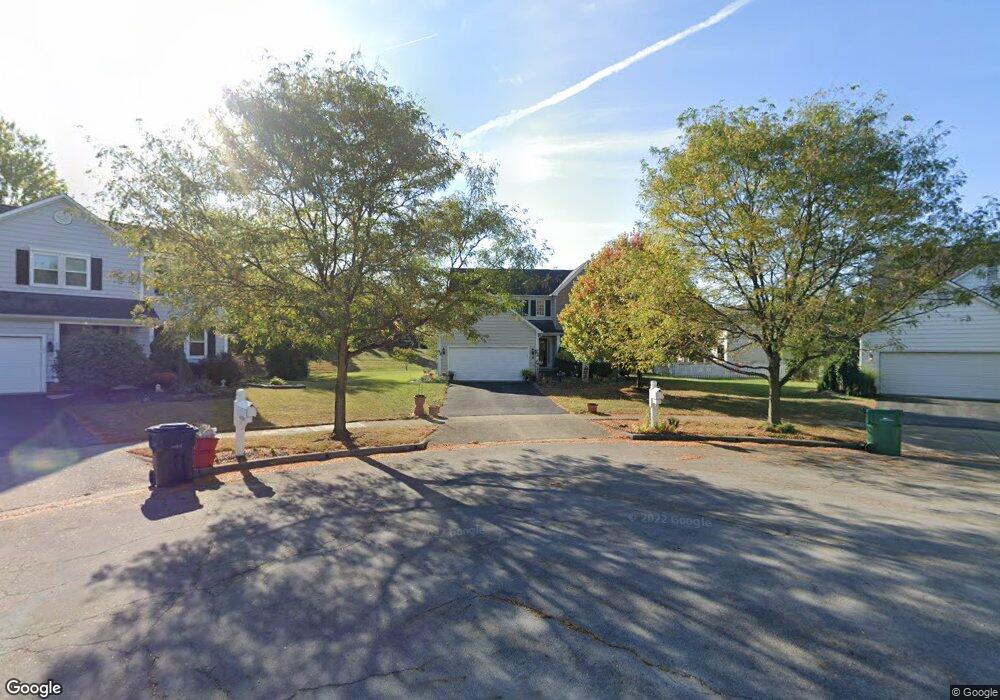
6120 Wentworth Ct Westerville, OH 43082
Genoa NeighborhoodEstimated Value: $407,000 - $496,000
4
Beds
3
Baths
2,112
Sq Ft
$221/Sq Ft
Est. Value
About This Home
This home is located at 6120 Wentworth Ct, Westerville, OH 43082 and is currently estimated at $466,360, approximately $220 per square foot. 6120 Wentworth Ct is a home located in Delaware County with nearby schools including Fouse Elementary School, Genoa Middle School, and Westerville Central High School.
Ownership History
Date
Name
Owned For
Owner Type
Purchase Details
Closed on
Jan 27, 2011
Sold by
Sawalha Heba A
Bought by
Sawalha Adnan and Sawalha Heba A
Current Estimated Value
Home Financials for this Owner
Home Financials are based on the most recent Mortgage that was taken out on this home.
Original Mortgage
$120,000
Outstanding Balance
$80,404
Interest Rate
4.5%
Mortgage Type
Purchase Money Mortgage
Estimated Equity
$385,956
Purchase Details
Closed on
Dec 9, 2010
Sold by
Beneficial Ohio Inc
Bought by
Sawalha Heba A
Home Financials for this Owner
Home Financials are based on the most recent Mortgage that was taken out on this home.
Original Mortgage
$120,000
Outstanding Balance
$80,404
Interest Rate
4.5%
Mortgage Type
Purchase Money Mortgage
Estimated Equity
$385,956
Purchase Details
Closed on
Aug 17, 2010
Sold by
Ulliman Peter C and Case #09 Cv E 11 1522
Bought by
Beneficial Ohio Inc
Purchase Details
Closed on
Oct 26, 1998
Sold by
Dominion Homes Inc
Bought by
Ulliman Peter C and Ulliman Deborah J
Create a Home Valuation Report for This Property
The Home Valuation Report is an in-depth analysis detailing your home's value as well as a comparison with similar homes in the area
Home Values in the Area
Average Home Value in this Area
Purchase History
| Date | Buyer | Sale Price | Title Company |
|---|---|---|---|
| Sawalha Adnan | -- | Attorney | |
| Sawalha Heba A | $178,000 | Attorney | |
| Beneficial Ohio Inc | $160,000 | None Available | |
| Ulliman Peter C | $187,775 | -- |
Source: Public Records
Mortgage History
| Date | Status | Borrower | Loan Amount |
|---|---|---|---|
| Open | Sawalha Heba A | $120,000 | |
| Closed | Ulliman Peter C | -- |
Source: Public Records
Tax History Compared to Growth
Tax History
| Year | Tax Paid | Tax Assessment Tax Assessment Total Assessment is a certain percentage of the fair market value that is determined by local assessors to be the total taxable value of land and additions on the property. | Land | Improvement |
|---|---|---|---|---|
| 2024 | $6,609 | $127,760 | $35,250 | $92,510 |
| 2023 | $6,478 | $127,760 | $35,250 | $92,510 |
| 2022 | $6,415 | $97,370 | $23,100 | $74,270 |
| 2021 | $6,479 | $97,370 | $23,100 | $74,270 |
| 2020 | $6,672 | $97,370 | $23,100 | $74,270 |
| 2019 | $5,695 | $79,630 | $19,250 | $60,380 |
| 2018 | $4,791 | $79,630 | $19,250 | $60,380 |
| 2017 | $4,476 | $67,800 | $16,630 | $51,170 |
| 2016 | $4,293 | $67,800 | $16,630 | $51,170 |
| 2015 | $4,258 | $67,800 | $16,630 | $51,170 |
| 2014 | $4,207 | $67,800 | $16,630 | $51,170 |
| 2013 | $3,792 | $62,310 | $16,630 | $45,680 |
Source: Public Records
Map
Nearby Homes
- 0 Paul Rd Unit 225001038
- 6573 Kenwood Place
- 5552 Quail Hollow Way
- 6410 Steinbeck Way
- 5515 Stillwater Ave
- 6623 Henschen Cir
- 5444 Quail Hollow Way
- 5633 Travis Pointe Ct
- 7373 Frasier Rd
- 5983 Congressional Dr
- 705 N State St Unit 211
- 6014 Commonwealth Dr
- 7268 Clancy Way
- 6082 Hilmar Dr
- 754 Kingsmead Rd Unit 18754
- 6086 Hemingway Place
- 6685 Tussic Street Rd
- 5532 Meadowood Ln
- 5259 Sorrento Ct
- 377 Westgreen Ln Unit 377
- 6108 Wentworth Ct
- 6124 Wentworth Ct
- 6097 Maidstone Ct
- 6085 Maidstone Ct
- 6735 Inverness St
- 6127 Wentworth Ct
- 6090 Maidstone Ct
- 6757 Inverness St
- 6119 Wentworth Ct
- 6101 Wentworth Ct
- 6084 Maidstone Ct
- 6699 Inverness St
- 6738 Inverness St
- 6072 Maidstone Ct
- 6752 Inverness St
- 6060 Maidstone Ct
- 6766 Inverness St
- 6772 S Old 3c Hwy
- 6800 S Old 3c Hwy
- 6778 Inverness St