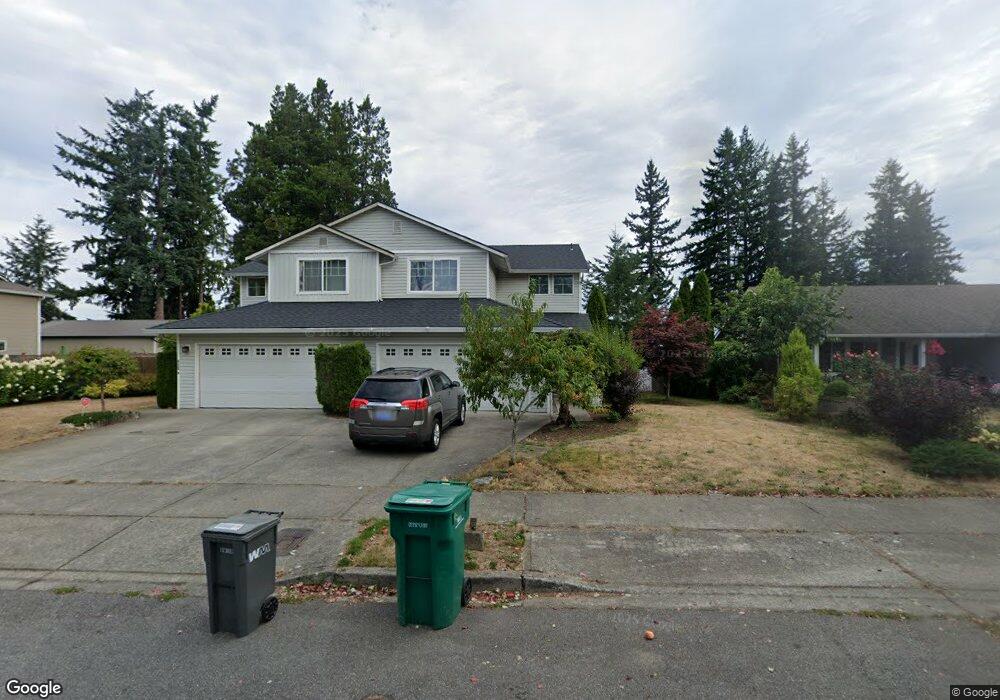
6121 209th St NE Unit 12 Arlington, WA 98223
Estimated Value: $456,000 - $496,000
3
Beds
3
Baths
1,550
Sq Ft
$303/Sq Ft
Est. Value
About This Home
This home is located at 6121 209th St NE Unit 12, Arlington, WA 98223 and is currently estimated at $470,387, approximately $303 per square foot. 6121 209th St NE Unit 12 is a home located in Snohomish County with nearby schools including Kent Prairie Elementary School, Post Middle School, and Arlington High School.
Ownership History
Date
Name
Owned For
Owner Type
Purchase Details
Closed on
Jun 6, 2022
Sold by
Benjamin Reyna Jr and Benjamin Jenna
Bought by
Castillo Gisela and Mata Israel
Current Estimated Value
Home Financials for this Owner
Home Financials are based on the most recent Mortgage that was taken out on this home.
Original Mortgage
$426,800
Outstanding Balance
$405,960
Interest Rate
5.23%
Mortgage Type
New Conventional
Estimated Equity
$64,427
Purchase Details
Closed on
Apr 19, 2017
Sold by
Skurok Lee E
Bought by
Reyna Benjamin and Reyna Jenna
Home Financials for this Owner
Home Financials are based on the most recent Mortgage that was taken out on this home.
Original Mortgage
$187,960
Interest Rate
4.3%
Mortgage Type
New Conventional
Purchase Details
Closed on
Nov 13, 2009
Sold by
Grandview North Llc
Bought by
Skurok Lee E
Home Financials for this Owner
Home Financials are based on the most recent Mortgage that was taken out on this home.
Original Mortgage
$206,632
Interest Rate
4.92%
Mortgage Type
New Conventional
Create a Home Valuation Report for This Property
The Home Valuation Report is an in-depth analysis detailing your home's value as well as a comparison with similar homes in the area
Home Values in the Area
Average Home Value in this Area
Purchase History
| Date | Buyer | Sale Price | Title Company |
|---|---|---|---|
| Castillo Gisela | -- | Chicago Title | |
| Reyna Benjamin | $234,950 | Chicago Title | |
| Skurok Lee E | $202,780 | Pnwt |
Source: Public Records
Mortgage History
| Date | Status | Borrower | Loan Amount |
|---|---|---|---|
| Open | Castillo Gisela | $426,800 | |
| Previous Owner | Reyna Benjamin | $187,960 | |
| Previous Owner | Skurok Lee E | $206,632 |
Source: Public Records
Tax History Compared to Growth
Tax History
| Year | Tax Paid | Tax Assessment Tax Assessment Total Assessment is a certain percentage of the fair market value that is determined by local assessors to be the total taxable value of land and additions on the property. | Land | Improvement |
|---|---|---|---|---|
| 2025 | $3,231 | $422,800 | $164,800 | $258,000 |
| 2024 | $3,231 | $375,600 | $126,500 | $249,100 |
| 2023 | $3,316 | $428,500 | $179,600 | $248,900 |
| 2022 | $3,144 | $336,400 | $144,500 | $191,900 |
| 2020 | $2,529 | $279,200 | $110,500 | $168,700 |
| 2019 | $2,445 | $263,100 | $101,900 | $161,200 |
| 2018 | $2,915 | $249,200 | $81,600 | $167,600 |
| 2017 | $2,463 | $214,800 | $58,400 | $156,400 |
| 2016 | $2,484 | $203,300 | $51,600 | $151,700 |
| 2015 | $2,340 | $184,600 | $40,900 | $143,700 |
| 2013 | $1,846 | $144,000 | $27,000 | $117,000 |
Source: Public Records
Map
Nearby Homes
- 19920 67th Ave NE Unit 40
- 0 77th Ave NE
- 7805 Jensen Farm Ln Unit G3
- 317 S Olympic Ave
- 20217 45th Dr NE
- 318 S French Ave
- 4502 200th St NE
- 0 Washington 9
- 20505 81st Dr NE
- 113 N Lenore Ave
- 6206 188th St NE Unit 63
- 19308 45th Dr NE
- 2015 Washington 530
- 7023 Falcon Ct
- 7018 Falcon Ct
- 12400 212th St NE
- 105 E Cox Ave Unit 4
- 105 E Cox Ave Unit 10
- 4609 190th St NE
- 910 Medical Center Dr Unit B-203
- 6121 209th St NE Unit A&B
- 6121 209th St NE Unit A
- 6121 209th St NE Unit 11
- 6121 209th St NE Unit B
- 6119 209th St NE
- 6125 209th St NE
- 6125 209th St NE Unit B
- 6125 209th St NE Unit A
- 6125 209th St NE Unit 10
- 6125 209th St NE Unit 9
- 6203 209th St NE
- 6211 209th St NE
- 6207 209th St NE
- 6115 209th St NE Unit 14
- 6115 209th St NE Unit 13
- 6115 209th St NE Unit B
- 6115 209th St NE Unit A
- 6111 209th St NE Unit A
- 6111 209th St NE Unit 16
- 6111 209th St NE Unit 15