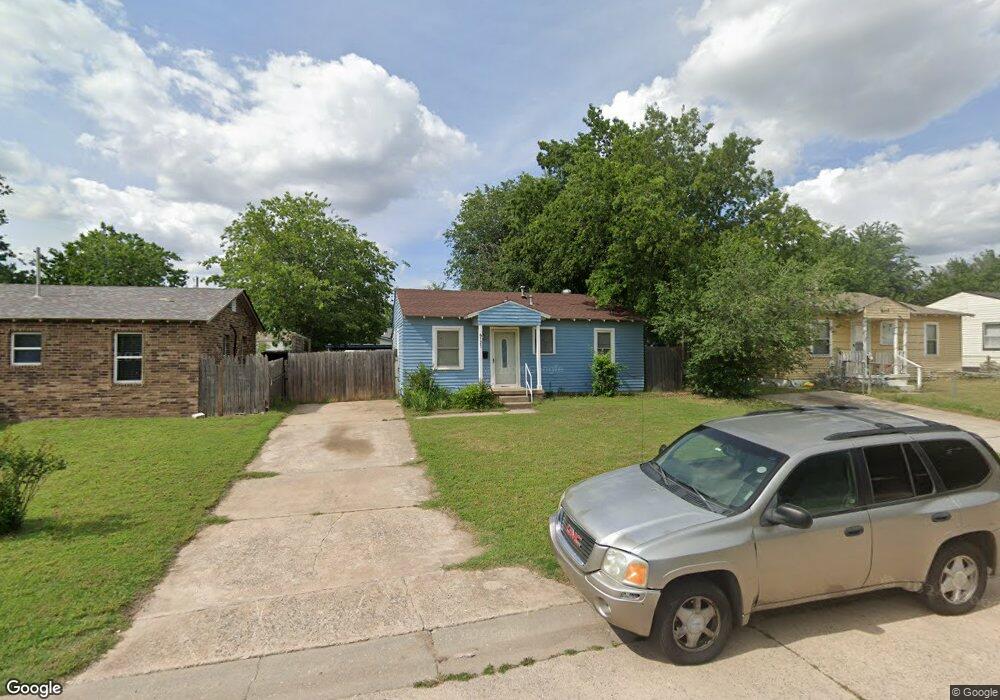
6121 NW 55th St Oklahoma City, OK 73122
Estimated Value: $128,000 - $154,000
2
Beds
1
Bath
720
Sq Ft
$195/Sq Ft
Est. Value
About This Home
This home is located at 6121 NW 55th St, Oklahoma City, OK 73122 and is currently estimated at $140,363, approximately $194 per square foot. 6121 NW 55th St is a home located in Oklahoma County with nearby schools including Central Elementary School, James L. Capps Middle School, and Putnam City High School.
Ownership History
Date
Name
Owned For
Owner Type
Purchase Details
Closed on
Dec 23, 2024
Sold by
Fraley James W and Fraley Jim W
Bought by
Fraley James W and Fraley Linda K
Current Estimated Value
Purchase Details
Closed on
Mar 19, 2008
Sold by
Holmes Luke and Holmes Michalyn
Bought by
Fraley Jim W
Home Financials for this Owner
Home Financials are based on the most recent Mortgage that was taken out on this home.
Original Mortgage
$48,000
Interest Rate
6.11%
Mortgage Type
Unknown
Purchase Details
Closed on
Feb 16, 2007
Sold by
Bank Of Oklahoma Na
Bought by
Holmes Luke
Purchase Details
Closed on
Sep 25, 2006
Sold by
Ooton Phillip Merle
Bought by
Bank Of Oklahoma Na
Purchase Details
Closed on
Oct 22, 2004
Sold by
Raymond Casey H and Raymond Cathy L
Bought by
Ooton Phillip Merle
Purchase Details
Closed on
May 2, 2002
Sold by
Raymond William E and Raymond Betty J
Bought by
Raymond Casey H
Create a Home Valuation Report for This Property
The Home Valuation Report is an in-depth analysis detailing your home's value as well as a comparison with similar homes in the area
Home Values in the Area
Average Home Value in this Area
Purchase History
| Date | Buyer | Sale Price | Title Company |
|---|---|---|---|
| Fraley James W | -- | None Listed On Document | |
| Fraley Jim W | $60,000 | Lawyers Title Of Ok City Inc | |
| Holmes Luke | $34,000 | Lawyers Title Of Ok City Inc | |
| Holmes Luke | $34,000 | Lawyers Title Of Ok City Inc | |
| Bank Of Oklahoma Na | $56,810 | None Available | |
| Ooton Phillip Merle | $55,000 | American Guaranty Title Co | |
| Raymond Casey H | $26,000 | -- |
Source: Public Records
Mortgage History
| Date | Status | Borrower | Loan Amount |
|---|---|---|---|
| Previous Owner | Fraley Jim W | $48,000 |
Source: Public Records
Tax History Compared to Growth
Tax History
| Year | Tax Paid | Tax Assessment Tax Assessment Total Assessment is a certain percentage of the fair market value that is determined by local assessors to be the total taxable value of land and additions on the property. | Land | Improvement |
|---|---|---|---|---|
| 2024 | $856 | $9,543 | $1,131 | $8,412 |
| 2023 | $856 | $9,265 | $1,112 | $8,153 |
| 2022 | $842 | $8,996 | $1,253 | $7,743 |
| 2021 | $807 | $8,734 | $1,443 | $7,291 |
| 2020 | $778 | $8,480 | $1,520 | $6,960 |
| 2019 | $742 | $8,233 | $1,412 | $6,821 |
| 2018 | $626 | $7,993 | $0 | $0 |
| 2017 | $605 | $7,760 | $1,432 | $6,328 |
| 2016 | $688 | $7,534 | $1,471 | $6,063 |
| 2015 | $692 | $7,536 | $1,375 | $6,161 |
| 2014 | $651 | $7,418 | $1,375 | $6,043 |
Source: Public Records
Map
Nearby Homes
- 6031 NW 53rd Terrace
- 6013 NW 55th St
- 5936 N Ione Dr
- 6024 NW 50th St
- 6808 NW 53rd St
- 6005 NW 58th Terrace
- 6112 NW 49th St
- 4908 N Central Rd
- 6101 NW 48th St
- 5905 NW 50th St
- 6804 NW 59th St
- 6203 NW 53rd St Unit 48
- 6019 NW 47th St
- 5213 N Dawson Dr
- 6605 Willowridge Dr
- 4808 N Willow Ave
- 5202 N Rockwell Ave
- 6712 NW 61st St
- 4604 N Donald Ave
- 6911 NW 59th Terrace
- 6117 NW 55th St
- 6125 NW 55th St
- 6113 NW 55th St
- 6120 NW 56th St
- 5600 N Donald Ave
- 5604 N Donald Ave
- 6116 NW 56th St
- 6124 NW 56th St
- 5608 N Donald Ave
- 6112 NW 56th St
- 6120 NW 55th St
- 6124 NW 55th St
- 6116 NW 55th St
- 5512 N Donald Ave
- 6108 NW 56th St
- 5612 N Donald Ave
- 6112 NW 55th St
- 6105 NW 55th St
- 6108 NW 55th St
- 6104 NW 56th St