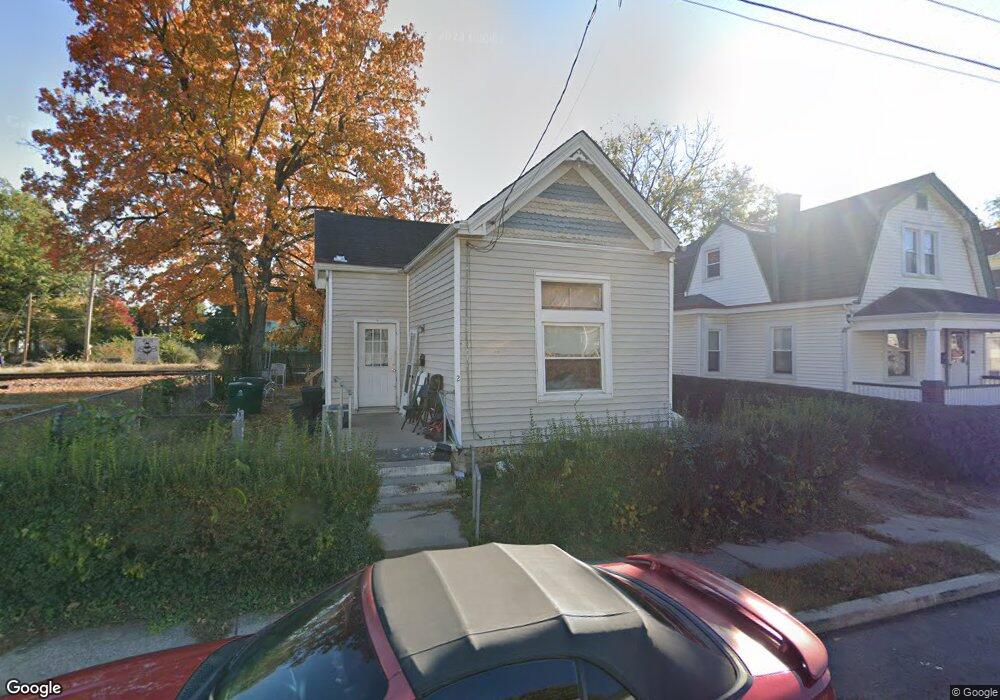
6123 Conover St Cincinnati, OH 45227
Madisonville NeighborhoodEstimated Value: $144,000 - $245,000
2
Beds
1
Bath
882
Sq Ft
$214/Sq Ft
Est. Value
About This Home
This home is located at 6123 Conover St, Cincinnati, OH 45227 and is currently estimated at $188,519, approximately $213 per square foot. 6123 Conover St is a home located in Hamilton County with nearby schools including John P. Parker School, Shroder High School, and Clark Montessori High School.
Ownership History
Date
Name
Owned For
Owner Type
Purchase Details
Closed on
Feb 5, 2013
Sold by
Kraimer Joseph B and Kraimer Mariko
Bought by
Jbk Cincinnati Partnership Llc
Current Estimated Value
Purchase Details
Closed on
Mar 17, 2009
Sold by
Secretary Of Housing & Urban Development
Bought by
Kraimer Joseph B and Kraimer John B
Purchase Details
Closed on
Sep 18, 2007
Sold by
Carter James L and Roe Richard
Bought by
Secretary Of Housing & Urban Development
Purchase Details
Closed on
Jan 31, 2002
Sold by
Heater Bonni D
Bought by
Carter James L
Home Financials for this Owner
Home Financials are based on the most recent Mortgage that was taken out on this home.
Original Mortgage
$51,688
Interest Rate
7.24%
Mortgage Type
FHA
Purchase Details
Closed on
Sep 15, 1995
Sold by
Stabler Greta
Bought by
Heater Bonni D
Home Financials for this Owner
Home Financials are based on the most recent Mortgage that was taken out on this home.
Original Mortgage
$39,000
Interest Rate
7.78%
Create a Home Valuation Report for This Property
The Home Valuation Report is an in-depth analysis detailing your home's value as well as a comparison with similar homes in the area
Home Values in the Area
Average Home Value in this Area
Purchase History
| Date | Buyer | Sale Price | Title Company |
|---|---|---|---|
| Jbk Cincinnati Partnership Llc | -- | None Available | |
| Kraimer Joseph B | $6,900 | Lakeside Title & Escrow Agen | |
| Secretary Of Housing & Urban Development | $20,000 | None Available | |
| Carter James L | $52,500 | -- | |
| Heater Bonni D | -- | -- |
Source: Public Records
Mortgage History
| Date | Status | Borrower | Loan Amount |
|---|---|---|---|
| Previous Owner | Carter James L | $51,688 | |
| Previous Owner | Heater Bonni D | $39,000 |
Source: Public Records
Tax History Compared to Growth
Tax History
| Year | Tax Paid | Tax Assessment Tax Assessment Total Assessment is a certain percentage of the fair market value that is determined by local assessors to be the total taxable value of land and additions on the property. | Land | Improvement |
|---|---|---|---|---|
| 2024 | $2,448 | $38,493 | $12,033 | $26,460 |
| 2023 | $2,452 | $38,493 | $12,033 | $26,460 |
| 2022 | $1,560 | $21,956 | $5,933 | $16,023 |
| 2021 | $1,530 | $21,956 | $5,933 | $16,023 |
| 2020 | $1,534 | $21,956 | $5,933 | $16,023 |
| 2019 | $1,492 | $19,429 | $5,250 | $14,179 |
| 2018 | $1,493 | $19,429 | $5,250 | $14,179 |
| 2017 | $1,438 | $19,429 | $5,250 | $14,179 |
| 2016 | $197 | $2,489 | $2,170 | $319 |
| 2015 | $177 | $2,489 | $2,170 | $319 |
| 2014 | $178 | $2,489 | $2,170 | $319 |
| 2013 | $176 | $2,415 | $2,107 | $308 |
Source: Public Records
Map
Nearby Homes
- 6119 Conover St
- 4815 Simpson Ave
- 6127 Conover St
- 6111 Conover St
- 6120 Conover St
- 6124 Conover St
- 6116 Conover St Unit 2
- 6112 Conover St
- 6202 Erie Ave
- 4818 Simpson Ave
- 6108 Conover St
- 4812 Mathis St
- 4810 Mathis St
- 4822 Simpson Ave
- 4806 Mathis St
- 6104 Conover St
- 4826 Simpson Ave
- 4828 Simpson Ave
- 6208 Erie Ave
- 6123 Prentice St