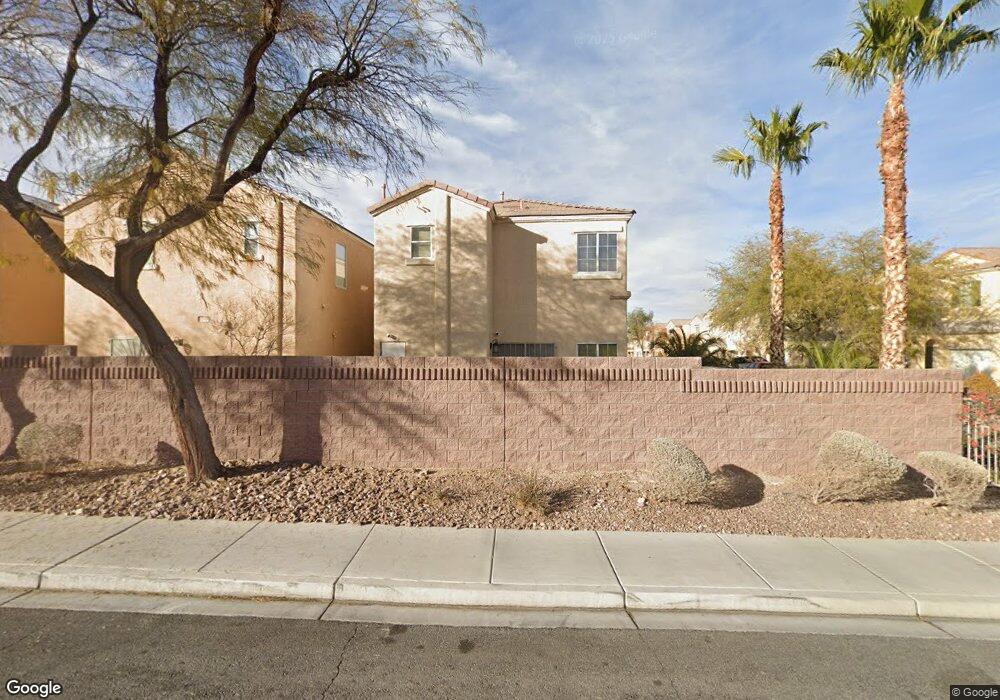
6123 Maple Oak Ave Las Vegas, NV 89139
Coronado Ranch NeighborhoodEstimated Value: $369,562 - $379,000
3
Beds
3
Baths
1,407
Sq Ft
$265/Sq Ft
Est. Value
About This Home
This home is located at 6123 Maple Oak Ave, Las Vegas, NV 89139 and is currently estimated at $373,141, approximately $265 per square foot. 6123 Maple Oak Ave is a home located in Clark County with nearby schools including Lawrence & Heidi Canarelli Middle School, Sierra Vista High School, and Doral Academy West Pebble.
Ownership History
Date
Name
Owned For
Owner Type
Purchase Details
Closed on
Jan 14, 2009
Sold by
Federal National Mortgage Association
Bought by
Maloney Cynthia A
Current Estimated Value
Home Financials for this Owner
Home Financials are based on the most recent Mortgage that was taken out on this home.
Original Mortgage
$133,142
Outstanding Balance
$86,026
Interest Rate
5.6%
Mortgage Type
FHA
Estimated Equity
$287,115
Purchase Details
Closed on
May 7, 2008
Sold by
Merhi Marwan
Bought by
Federal National Mortgage Association
Purchase Details
Closed on
Jul 23, 2004
Sold by
Richmond American Homes Of Nevada
Bought by
Merhi Marwan
Home Financials for this Owner
Home Financials are based on the most recent Mortgage that was taken out on this home.
Original Mortgage
$210,429
Interest Rate
5.25%
Mortgage Type
New Conventional
Create a Home Valuation Report for This Property
The Home Valuation Report is an in-depth analysis detailing your home's value as well as a comparison with similar homes in the area
Home Values in the Area
Average Home Value in this Area
Purchase History
| Date | Buyer | Sale Price | Title Company |
|---|---|---|---|
| Maloney Cynthia A | $134,900 | Lawyers Title Of Nevada Cent | |
| Federal National Mortgage Association | -- | Fidelity National | |
| Merhi Marwan | $221,505 | Chicago Title |
Source: Public Records
Mortgage History
| Date | Status | Borrower | Loan Amount |
|---|---|---|---|
| Open | Maloney Cynthia A | $133,142 | |
| Previous Owner | Merhi Marwan | $210,429 |
Source: Public Records
Tax History Compared to Growth
Tax History
| Year | Tax Paid | Tax Assessment Tax Assessment Total Assessment is a certain percentage of the fair market value that is determined by local assessors to be the total taxable value of land and additions on the property. | Land | Improvement |
|---|---|---|---|---|
| 2025 | $1,227 | $88,222 | $29,750 | $58,472 |
| 2024 | $1,192 | $88,222 | $29,750 | $58,472 |
| 2023 | $1,192 | $82,102 | $26,950 | $55,152 |
| 2022 | $1,157 | $73,786 | $23,450 | $50,336 |
| 2021 | $1,174 | $69,180 | $21,350 | $47,830 |
| 2020 | $1,088 | $68,739 | $21,350 | $47,389 |
| 2019 | $1,019 | $64,451 | $17,850 | $46,601 |
| 2018 | $973 | $57,511 | $12,950 | $44,561 |
| 2017 | $1,680 | $57,296 | $12,250 | $45,046 |
| 2016 | $912 | $49,314 | $8,750 | $40,564 |
| 2015 | $909 | $44,783 | $8,050 | $36,733 |
| 2014 | $881 | $29,126 | $4,200 | $24,926 |
Source: Public Records
Map
Nearby Homes
- 7463 Grizzly Giant St
- 7451 Grizzly Giant St
- 7553 Rustic Galleon St
- 6263 Oread Ave
- 6111 Walker Valley Ct
- 6016 Sombria Ridge Ave
- 7478 Coastal Ledge St
- 6315 Anticline Ave Unit 1
- 6283 Lapilli Ave
- 7435 Silurian St
- 6303 Scree Ct
- 7658 Sandhaven St
- 7665 Sandhaven St
- 7293 Puffer Lake Ct
- 7688 Sandhaven St
- 7252 Puffer Lake Ct
- 7638 Hope Valley St
- 7552 Wentworth Springs Ct
- 7468 Treasure Chest St
- 6378 Bright Nimbus Ave
- 6129 Maple Oak Ave
- 6135 Maple Oak Ave
- 7492 Grizzly Giant St
- 7486 Grizzly Giant St
- 6141 Maple Oak Ave
- 7480 Grizzly Giant St
- 7469 Grizzly Giant St
- 7474 Grizzly Giant St
- 6147 Maple Oak Ave
- 7470 Merced Grove Ct
- 6124 Squilchuck Ct
- 6118 Squilchuck Ct
- 6130 Squilchuck Ct
- 6130 Squilchuck Ct
- 7468 Grizzly Giant St
- 6112 Squilchuck Ct
- 6153 Maple Oak Ave
- 7464 Merced Grove Ct
- 7457 Grizzly Giant St Unit none
- 7457 Grizzly Giant St