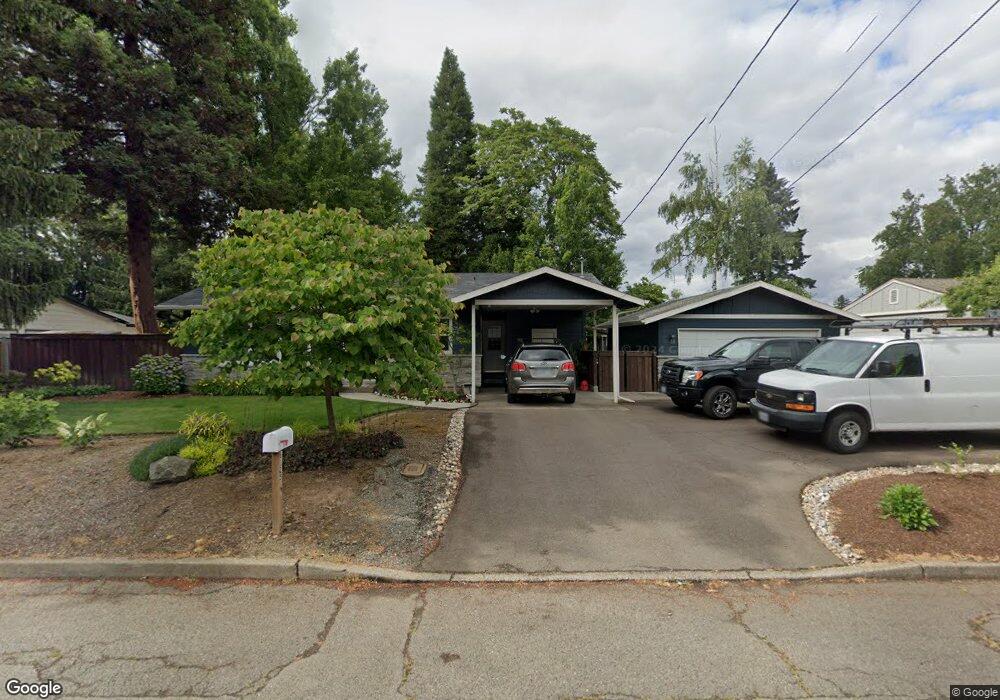
6125 SW Shakespeare St Lake Oswego, OR 97035
Lake Forest NeighborhoodEstimated Value: $564,634 - $615,000
3
Beds
6
Baths
1,100
Sq Ft
$529/Sq Ft
Est. Value
About This Home
This home is located at 6125 SW Shakespeare St, Lake Oswego, OR 97035 and is currently estimated at $582,159, approximately $529 per square foot. 6125 SW Shakespeare St is a home located in Clackamas County with nearby schools including River Grove Elementary School, Lakeridge Middle School, and Lakeridge High School.
Ownership History
Date
Name
Owned For
Owner Type
Purchase Details
Closed on
Aug 31, 2007
Sold by
Smith Martin E and Smith Jody A
Bought by
Nesbitt Timothy J
Current Estimated Value
Home Financials for this Owner
Home Financials are based on the most recent Mortgage that was taken out on this home.
Original Mortgage
$269,910
Outstanding Balance
$170,981
Interest Rate
6.67%
Mortgage Type
Purchase Money Mortgage
Estimated Equity
$411,178
Purchase Details
Closed on
Aug 17, 2005
Sold by
Swanson Lori Joanne and Gustafson Lori Joanne
Bought by
Smith Martin E and Smith Jody A
Home Financials for this Owner
Home Financials are based on the most recent Mortgage that was taken out on this home.
Original Mortgage
$207,900
Interest Rate
5.87%
Mortgage Type
Fannie Mae Freddie Mac
Purchase Details
Closed on
Aug 13, 1996
Sold by
Loomis Janette
Bought by
Gustafson Lori Joanne
Home Financials for this Owner
Home Financials are based on the most recent Mortgage that was taken out on this home.
Original Mortgage
$112,800
Interest Rate
8.18%
Create a Home Valuation Report for This Property
The Home Valuation Report is an in-depth analysis detailing your home's value as well as a comparison with similar homes in the area
Home Values in the Area
Average Home Value in this Area
Purchase History
| Date | Buyer | Sale Price | Title Company |
|---|---|---|---|
| Nesbitt Timothy J | $299,900 | Chicago Title Insurance Co | |
| Smith Martin E | $259,900 | Ticor Title Insurance Compan | |
| Gustafson Lori Joanne | $141,000 | Chicago Title Insurance Co |
Source: Public Records
Mortgage History
| Date | Status | Borrower | Loan Amount |
|---|---|---|---|
| Open | Nesbitt Timothy J | $269,910 | |
| Previous Owner | Smith Martin E | $207,900 | |
| Previous Owner | Gustafson Lori Joanne | $112,800 |
Source: Public Records
Tax History Compared to Growth
Tax History
| Year | Tax Paid | Tax Assessment Tax Assessment Total Assessment is a certain percentage of the fair market value that is determined by local assessors to be the total taxable value of land and additions on the property. | Land | Improvement |
|---|---|---|---|---|
| 2025 | $3,830 | $217,338 | -- | -- |
| 2024 | $3,685 | $211,008 | -- | -- |
| 2023 | $3,685 | $204,863 | $0 | $0 |
| 2022 | $3,477 | $198,897 | $0 | $0 |
| 2021 | $3,188 | $193,104 | $0 | $0 |
| 2020 | $3,108 | $187,480 | $0 | $0 |
| 2019 | $3,024 | $182,020 | $0 | $0 |
| 2018 | $2,867 | $176,718 | $0 | $0 |
| 2017 | $2,761 | $171,571 | $0 | $0 |
| 2016 | $2,488 | $166,574 | $0 | $0 |
| 2015 | $2,397 | $161,722 | $0 | $0 |
| 2014 | $2,330 | $157,012 | $0 | $0 |
Source: Public Records
Map
Nearby Homes
- 15540 Partridge Dr
- 6300 Shakespeare St
- 5835 Carman Dr
- 5767 Baleine St
- 6290 Carman Dr
- 6290 SW Carman Dr
- 5725 Windfield Loop
- 16405 Bonaire Ave
- 5185 Carman Dr
- 16508 Bonaire Ave
- 5010 Park Bluff Place
- 4992 Park Bluff Place
- 16960 Denney Ct
- 15601 Manchester Dr
- 4974 Park Bluff Place
- 16061 Waluga Dr
- 5057 W Sunset Dr
- 5328 Lower Dr
- 4521 Trillium Woods
- 4520 Trillium Woods
- 6125 Shakespeare St
- 6105 Shakespeare St
- 6135 Shakespeare St
- 6120 SW Shakespeare St
- 6110 Burma Rd
- 6120 Shakespeare St
- 6110 SW Burma Rd
- 6080 Burma Rd
- 6110 Shakespeare St
- 6055 Shakespeare St
- 6140 Burma Rd
- 6140 Shakespeare St
- 6157 Shakespeare St
- 6062 SW Burma Rd
- 6062 Burma Rd
- 6072 Shakespeare St
- 6160 SW Shakespeare St
- 6180 Burma Rd
- 6160 Shakespeare St
- 6011 Shakespeare St