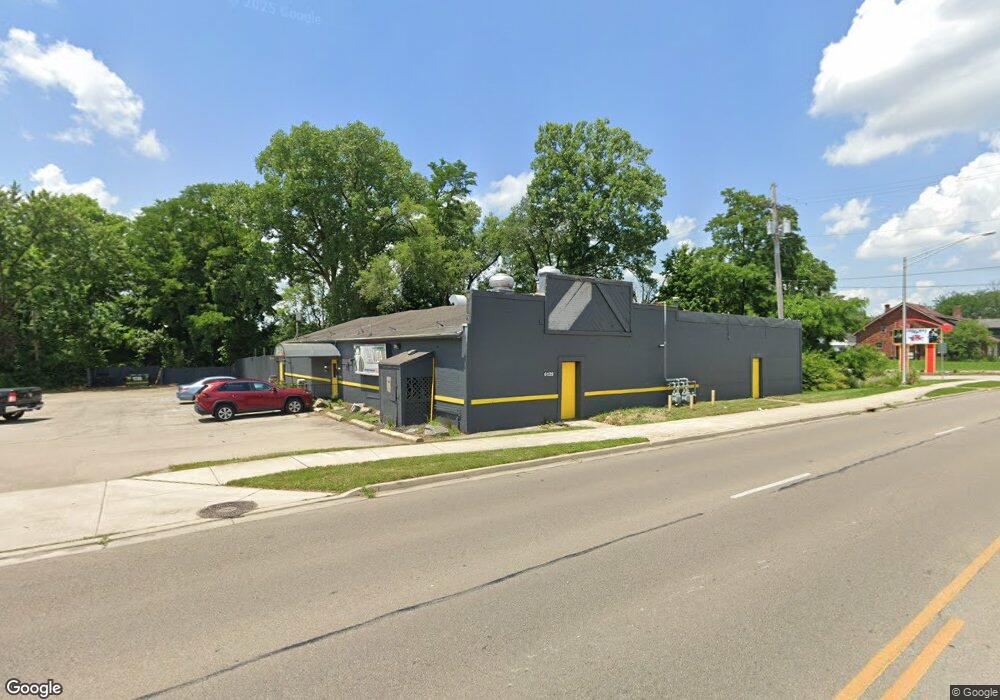
6129 N Dixie Dr Dayton, OH 45414
Northridge NeighborhoodEstimated Value: $110,240
Studio
--
Bath
5,660
Sq Ft
$19/Sq Ft
Est. Value
About This Home
This home is located at 6129 N Dixie Dr, Dayton, OH 45414 and is currently estimated at $110,240, approximately $19 per square foot. 6129 N Dixie Dr is a home located in Montgomery County with nearby schools including Northridge High School, Horizon Science Academy-Dayton Elementary School, and Horizon Science Academy Dayton High School.
Ownership History
Date
Name
Owned For
Owner Type
Purchase Details
Closed on
Nov 20, 2024
Sold by
Meshesha Seblewongel
Bought by
Empire Commercial Leasing Llc
Current Estimated Value
Purchase Details
Closed on
Mar 15, 2019
Sold by
Action Wear Fashions Inc
Bought by
Meshesha Scblewongel
Purchase Details
Closed on
Oct 31, 2014
Sold by
Childers Kenny
Bought by
Heinz Elden
Purchase Details
Closed on
Oct 17, 2014
Sold by
N E H Properties Inc
Bought by
Board Of County Commissioners Of Montogo
Purchase Details
Closed on
Oct 14, 2014
Sold by
Heinz Elden
Bought by
Action Wear Fashions Inc
Purchase Details
Closed on
Mar 20, 2009
Sold by
Childers Kenny
Bought by
N E H Properties Inc
Purchase Details
Closed on
Jul 17, 1998
Sold by
Childers Kenny R and Childers Linda S
Bought by
Childers Arlie
Purchase Details
Closed on
Feb 28, 1998
Sold by
Bta Enterprises Inc
Bought by
Childers Kenny R and Childers Linda S
Create a Home Valuation Report for This Property
The Home Valuation Report is an in-depth analysis detailing your home's value as well as a comparison with similar homes in the area
Home Values in the Area
Average Home Value in this Area
Purchase History
| Date | Buyer | Sale Price | Title Company |
|---|---|---|---|
| Empire Commercial Leasing Llc | $105,000 | None Listed On Document | |
| Empire Commercial Leasing Llc | $105,000 | None Listed On Document | |
| Meshesha Scblewongel | $105,000 | Landmark Ttl Agcy South Inc | |
| Heinz Elden | -- | None Available | |
| Board Of County Commissioners Of Montogo | $10,506 | None Available | |
| Action Wear Fashions Inc | $58,700 | None Available | |
| N E H Properties Inc | $150,000 | Vantage Land Title Inc | |
| Childers Arlie | $180,000 | -- | |
| Childers Arlie | $180,000 | -- | |
| Childers Kenny R | $108,500 | -- | |
| Childers Kenny R | $108,500 | -- |
Source: Public Records
Tax History
| Year | Tax Paid | Tax Assessment Tax Assessment Total Assessment is a certain percentage of the fair market value that is determined by local assessors to be the total taxable value of land and additions on the property. | Land | Improvement |
|---|---|---|---|---|
| 2025 | $5,419 | $40,860 | $33,520 | $7,340 |
| 2024 | $5,244 | $40,860 | $33,520 | $7,340 |
| 2023 | $5,244 | $40,860 | $33,520 | $7,340 |
| 2022 | $5,101 | $36,170 | $29,670 | $6,500 |
| 2021 | $5,128 | $36,170 | $29,670 | $6,500 |
| 2020 | $5,188 | $36,170 | $29,670 | $6,500 |
| 2019 | $8,274 | $58,080 | $29,670 | $28,410 |
| 2018 | $8,315 | $58,080 | $29,670 | $28,410 |
| 2017 | $8,354 | $58,080 | $29,670 | $28,410 |
| 2016 | $8,412 | $58,080 | $29,670 | $28,410 |
| 2015 | $7,504 | $58,080 | $29,670 | $28,410 |
| 2014 | $7,504 | $58,810 | $30,400 | $28,410 |
| 2012 | -- | $52,660 | $26,750 | $25,910 |
Source: Public Records
Map
Nearby Homes
- 2109 Cadie Ave
- 2160 Martin Ave
- 2020 Wilding Ave
- 2211 Martin Ave
- 2006 High Knoll Dr
- 1657 Scenic Dr
- 2110 Needmore Rd
- 2118 Titus Ave
- 4908 Northcutt Place
- 5563 Fair Valley Rd
- 3185 Stop 8 Rd
- 6114 Miller Ln
- 2307 Stop 8 Rd
- 5356 Wood Dale Dr
- 3280 Benchwood Rd
- 3320 Benchwood Rd
- 5408 Galt Ct
- 8090 Dog Leg Rd
- 6208 Rosecrest Dr
- 6513 Walnut Ridge Rd
- 6116 N Dixie Dr
- 2000 Gipsy Dr
- 2001 Cardinal Ave
- 6236 N Dixie Dr
- 2005 Gipsy Dr
- 2005 Cardinal Ave
- 2022 Cardinal Ave
- 6051 N Dixie Dr
- 2007 Gipsy Dr
- 2011 Cardinal Ave
- 2006 Cardinal Ave
- 2004 Nomad Ave
- 2018 Gipsy Dr
- 6036 N Dixie Dr
- 6036 N Dixie Dr
- 2017 Gipsy Dr
- 6304 N Dixie Dr
- 2016 Cardinal Ave
- 2022 Gipsy Dr
- 2008 Nomad Ave
Your Personal Tour Guide
Ask me questions while you tour the home.