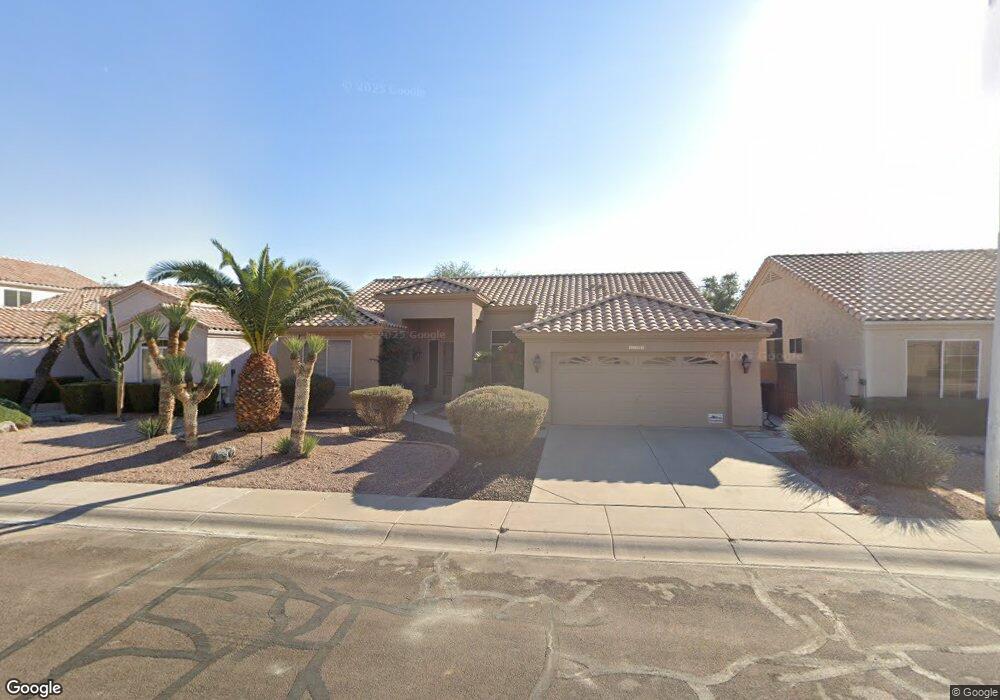
6129 W Megan St Unit 2 Chandler, AZ 85226
West Chandler NeighborhoodEstimated Value: $544,155 - $642,000
--
Bed
3
Baths
2,008
Sq Ft
$299/Sq Ft
Est. Value
About This Home
This home is located at 6129 W Megan St Unit 2, Chandler, AZ 85226 and is currently estimated at $600,039, approximately $298 per square foot. 6129 W Megan St Unit 2 is a home located in Maricopa County with nearby schools including Kyrene de la Mirada Elementary School, Kyrene del Pueblo Middle School, and Mountain Pointe High School.
Ownership History
Date
Name
Owned For
Owner Type
Purchase Details
Closed on
May 30, 2002
Sold by
Gebbie Wayne L and Anderson Dede C
Bought by
Wood Justin G
Current Estimated Value
Home Financials for this Owner
Home Financials are based on the most recent Mortgage that was taken out on this home.
Original Mortgage
$179,120
Outstanding Balance
$76,164
Interest Rate
6.89%
Mortgage Type
New Conventional
Estimated Equity
$523,875
Purchase Details
Closed on
Jul 17, 2001
Sold by
John Richard Scott and John Nancy Ellen
Bought by
Gebbie Wayne L and Anderson Dede C
Home Financials for this Owner
Home Financials are based on the most recent Mortgage that was taken out on this home.
Original Mortgage
$119,000
Interest Rate
7%
Mortgage Type
New Conventional
Purchase Details
Closed on
Apr 9, 2001
Sold by
John Richard Scott and John Nancy Ellen
Bought by
John Richard Scott and John Nancy Ellen
Purchase Details
Closed on
May 15, 1996
Sold by
Smith Edwin Victor
Bought by
John Richard Scott and John Nancy Ellen
Create a Home Valuation Report for This Property
The Home Valuation Report is an in-depth analysis detailing your home's value as well as a comparison with similar homes in the area
Home Values in the Area
Average Home Value in this Area
Purchase History
| Date | Buyer | Sale Price | Title Company |
|---|---|---|---|
| Wood Justin G | $223,900 | Security Title Agency | |
| Gebbie Wayne L | $214,000 | First American Title | |
| John Richard Scott | -- | -- | |
| John Richard Scott | -- | -- | |
| Smith Edwin Victor | -- | -- |
Source: Public Records
Mortgage History
| Date | Status | Borrower | Loan Amount |
|---|---|---|---|
| Open | Wood Justin G | $179,120 | |
| Previous Owner | Gebbie Wayne L | $119,000 |
Source: Public Records
Tax History Compared to Growth
Tax History
| Year | Tax Paid | Tax Assessment Tax Assessment Total Assessment is a certain percentage of the fair market value that is determined by local assessors to be the total taxable value of land and additions on the property. | Land | Improvement |
|---|---|---|---|---|
| 2025 | $2,491 | $31,268 | -- | -- |
| 2024 | $2,382 | $29,779 | -- | -- |
| 2023 | $2,382 | $45,260 | $9,050 | $36,210 |
| 2022 | $2,268 | $34,300 | $6,860 | $27,440 |
| 2021 | $2,391 | $32,420 | $6,480 | $25,940 |
| 2020 | $2,337 | $29,970 | $5,990 | $23,980 |
| 2019 | $2,268 | $28,910 | $5,780 | $23,130 |
| 2018 | $2,194 | $27,550 | $5,510 | $22,040 |
| 2017 | $2,090 | $27,070 | $5,410 | $21,660 |
| 2016 | $2,134 | $27,370 | $5,470 | $21,900 |
| 2015 | $1,969 | $23,300 | $4,660 | $18,640 |
Source: Public Records
Map
Nearby Homes
- 6302 W Megan St
- 6450 W Gary Dr
- 6551 W Shannon Ct Unit 1
- 6491 W Linda Ln
- 6570 W Linda Ct
- 5959 W Del Rio St
- 5726 W Ivanhoe St
- 687 N Gregory Place
- 5751 W Del Rio St
- 500 N Roosevelt Ave Unit 2
- 500 N Roosevelt Ave Unit 87
- 500 N Roosevelt Ave Unit 40
- 500 N Roosevelt Ave Unit 26
- 6673 W Ivanhoe St
- 311 W Jeanine Dr Unit 2
- 881 N Pineview Dr
- 1284 W Stacey Ln Unit 1
- 6842 W Linda Ln Unit 1
- 6852 W Ivanhoe St
- 500 N Gila Springs Blvd Unit 230
- 6119 W Megan St Unit 2
- 6139 W Megan St Unit 2
- 6109 W Megan St
- 6159 W Megan St
- 6140 W Shannon St
- 6128 W Megan St
- 6138 W Megan St
- 6160 W Shannon St Unit 2
- 6099 W Megan St
- 6118 W Megan St
- 6130 W Shannon St
- 6148 W Megan St
- 6169 W Megan St
- 6108 W Megan St
- 6120 W Shannon St
- 6170 W Shannon St
- 6158 W Megan St
- 6089 W Megan St
- 6100 W Shannon St
- 6179 W Megan St