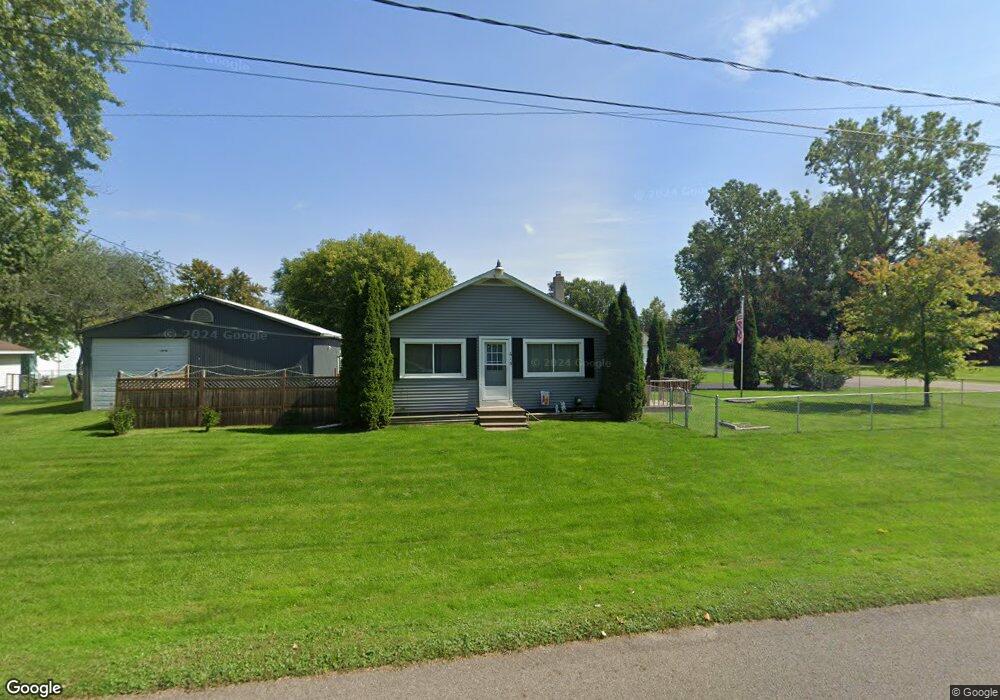
613 21st St Jackson, MI 49203
Estimated Value: $149,000 - $197,000
2
Beds
1
Bath
936
Sq Ft
$176/Sq Ft
Est. Value
About This Home
This home is located at 613 21st St, Jackson, MI 49203 and is currently estimated at $165,065, approximately $176 per square foot. 613 21st St is a home located in Jackson County with nearby schools including Hunt Elementary School, Middle School at Parkside, and Jackson High School.
Ownership History
Date
Name
Owned For
Owner Type
Purchase Details
Closed on
Feb 19, 2021
Sold by
Burnett Joyce C and Burnett James A
Bought by
Burnett James A
Current Estimated Value
Home Financials for this Owner
Home Financials are based on the most recent Mortgage that was taken out on this home.
Original Mortgage
$81,000
Outstanding Balance
$72,446
Interest Rate
2.7%
Mortgage Type
New Conventional
Estimated Equity
$92,619
Purchase Details
Closed on
Feb 28, 2017
Sold by
Hunter Lucinda Elaine
Bought by
Burnett James A
Purchase Details
Closed on
May 31, 2011
Sold by
Burnett Robert A and Burnett Joyce C
Bought by
Burnett Robert A and Burnett Joyce C
Purchase Details
Closed on
May 17, 2004
Sold by
Reeser Melvin H and Reeser Bonnie
Bought by
Reeser Randy E
Home Financials for this Owner
Home Financials are based on the most recent Mortgage that was taken out on this home.
Original Mortgage
$69,600
Interest Rate
7.2%
Mortgage Type
Purchase Money Mortgage
Create a Home Valuation Report for This Property
The Home Valuation Report is an in-depth analysis detailing your home's value as well as a comparison with similar homes in the area
Home Values in the Area
Average Home Value in this Area
Purchase History
We collect this data history from publicly available records. To have your information removed, we recommend requesting removal directly through your county’s website.
| Date | Buyer | Sale Price | Title Company |
|---|---|---|---|
| Burnett James A | -- | None Available | |
| Burnett James A | -- | Title Solutions Agency Llc | |
| Burnett Robert A | -- | None Available | |
| Reeser Randy E | $43,500 | At |
Source: Public Records
Mortgage History
We collect this data history from publicly available records. To have your information removed, we recommend requesting removal directly through your county’s website.
| Date | Status | Borrower | Loan Amount |
|---|---|---|---|
| Open | Burnett James A | $81,000 | |
| Previous Owner | Reeser Randy E | $69,600 |
Source: Public Records
Tax History
| Year | Tax Paid | Tax Assessment Tax Assessment Total Assessment is a certain percentage of the fair market value that is determined by local assessors to be the total taxable value of land and additions on the property. | Land | Improvement |
|---|---|---|---|---|
| 2025 | $757 | $63,200 | $0 | $0 |
| 2024 | $7 | $55,100 | $0 | $0 |
| 2023 | $701 | $48,800 | $0 | $0 |
| 2022 | $1,048 | $43,900 | $0 | $0 |
| 2021 | $1,035 | $42,500 | $0 | $0 |
| 2020 | $1,024 | $39,200 | $0 | $0 |
| 2019 | $1,256 | $35,900 | $0 | $0 |
| 2018 | $979 | $33,300 | $0 | $0 |
| 2017 | $783 | $31,500 | $0 | $0 |
| 2016 | $520 | $29,400 | $29,400 | $0 |
| 2015 | $744 | $27,300 | $27,300 | $0 |
| 2014 | $744 | $26,000 | $26,000 | $0 |
| 2013 | -- | $26,000 | $26,000 | $0 |
Source: Public Records
Map
Nearby Homes
- 2105 Carlton Blvd
- 528 18th St
- 610 17th St
- 2005 Cortland Blvd
- 1249 Levant St
- 123 N Higby St
- 114 S Wisner St
- 108 N Thompson St
- 1005 S Wisner St
- 109 N Thompson St
- 334 Marion St
- 214 N Durand St
- 1000 W Washington Ave
- 1115 Oakdale Ave
- 0 Laurence Ave Unit 25062864
- 810 Union St
- 3250 Carlton Blvd
- 1017 S Grinnell St
- 1002 S West Ave
- 202 S West Ave
Your Personal Tour Guide
Ask me questions while you tour the home.