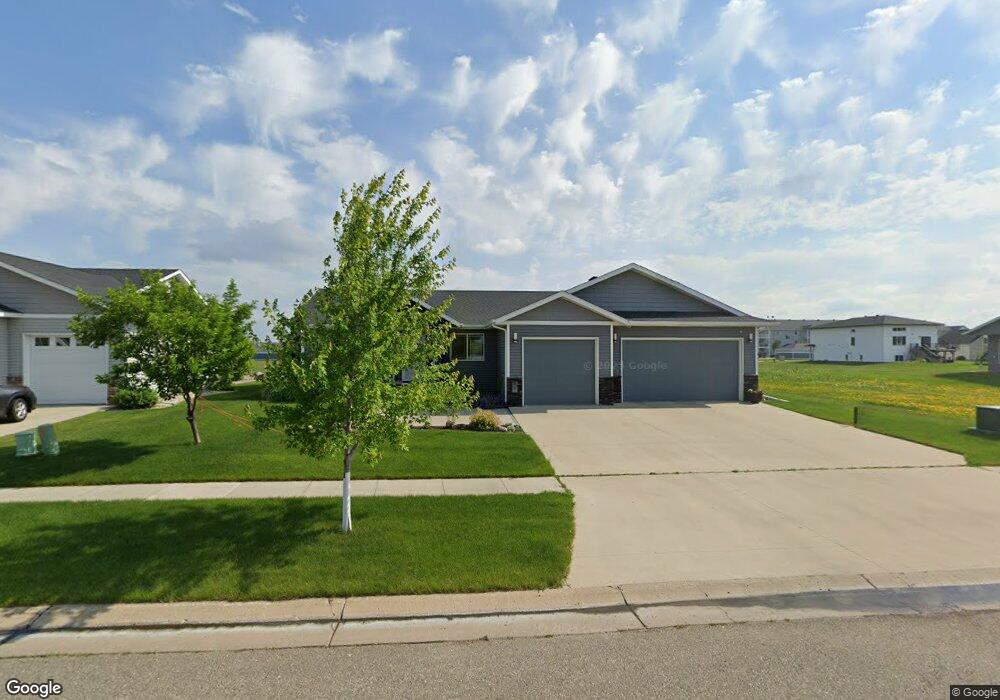
613 27th Ave W West Fargo, ND 58078
Eaglewood NeighborhoodEstimated Value: $532,000 - $562,443
5
Beds
3
Baths
3,632
Sq Ft
$151/Sq Ft
Est. Value
About This Home
This home is located at 613 27th Ave W, West Fargo, ND 58078 and is currently estimated at $547,222, approximately $150 per square foot. 613 27th Ave W is a home located in Cass County with nearby schools including Brooks Harbor Elementary School, Liberty Middle School, and West Fargo Sheyenne High School.
Ownership History
Date
Name
Owned For
Owner Type
Purchase Details
Closed on
Oct 9, 2020
Sold by
Spangler Christopher R and Spangler Kayla R
Bought by
Kotala Pratap and Gundala Kavitha
Current Estimated Value
Home Financials for this Owner
Home Financials are based on the most recent Mortgage that was taken out on this home.
Original Mortgage
$273,000
Outstanding Balance
$196,215
Interest Rate
2.9%
Mortgage Type
New Conventional
Estimated Equity
$351,007
Purchase Details
Closed on
May 16, 2014
Sold by
Westwood Development Llc
Bought by
Turn Key Construction Inc
Create a Home Valuation Report for This Property
The Home Valuation Report is an in-depth analysis detailing your home's value as well as a comparison with similar homes in the area
Home Values in the Area
Average Home Value in this Area
Purchase History
| Date | Buyer | Sale Price | Title Company |
|---|---|---|---|
| Kotala Pratap | $403,000 | The Title Co | |
| Turn Key Construction Inc | -- | None Available |
Source: Public Records
Mortgage History
| Date | Status | Borrower | Loan Amount |
|---|---|---|---|
| Open | Kotala Pratap | $273,000 |
Source: Public Records
Tax History Compared to Growth
Tax History
| Year | Tax Paid | Tax Assessment Tax Assessment Total Assessment is a certain percentage of the fair market value that is determined by local assessors to be the total taxable value of land and additions on the property. | Land | Improvement |
|---|---|---|---|---|
| 2024 | $7,108 | $279,650 | $39,400 | $240,250 |
| 2023 | $7,235 | $265,450 | $39,400 | $226,050 |
| 2022 | $6,775 | $243,600 | $39,400 | $204,200 |
| 2021 | $5,724 | $202,450 | $27,550 | $174,900 |
| 2020 | $5,712 | $209,800 | $27,550 | $182,250 |
| 2019 | $8,565 | $202,300 | $27,550 | $174,750 |
| 2018 | $8,462 | $202,300 | $27,550 | $174,750 |
| 2017 | $6,266 | $121,950 | $27,550 | $94,400 |
| 2016 | $5,374 | $98,050 | $27,550 | $70,500 |
| 2015 | $7,424 | $171,700 | $23,950 | $147,750 |
| 2014 | $2,918 | $16,750 | $16,750 | $0 |
| 2013 | $456 | $250 | $250 | $0 |
Source: Public Records
Map
Nearby Homes
- 2733 Divide St W
- 2728 Westwood St W
- 713 23rd Ave W
- 2737 10th St W
- 939 Eaglewood Ave
- 2735 11th St W
- 922 31st Ave W
- 1015 29th Ave W
- 1127 24th Ave W
- 360 32nd Ave W Unit 608
- 360 32nd Ave W Unit 508
- 945 31st Ave W
- 2734 12th St W
- 2216 10th Ct W
- 2170 Dock Dr
- 2427 Harbor Ln
- 1220 Legion Ln W
- 2704 14th St W
- 2836 River's Bend Dr E
- 2101 10th St W