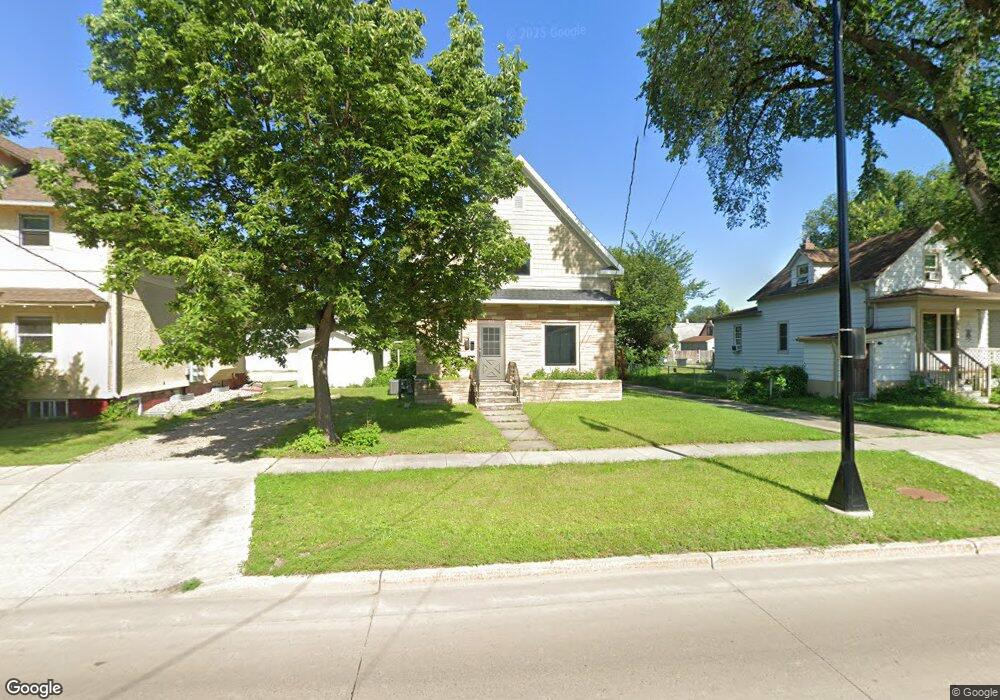
613 2nd St N Fargo, ND 58102
Horace Mann NeighborhoodEstimated Value: $137,000 - $264,000
4
Beds
3
Baths
2,242
Sq Ft
$86/Sq Ft
Est. Value
About This Home
This home is located at 613 2nd St N, Fargo, ND 58102 and is currently estimated at $193,842, approximately $86 per square foot. 613 2nd St N is a home located in Cass County with nearby schools including Horace Mann Roosevelt Elementary School, Ben Franklin Middle School, and North High School.
Ownership History
Date
Name
Owned For
Owner Type
Purchase Details
Closed on
Apr 12, 2024
Sold by
Althoff Investments Llc
Bought by
Whiskey Birdie Llc
Current Estimated Value
Purchase Details
Closed on
Feb 19, 2021
Sold by
Pladson Jean and Pladson Jean M
Bought by
River City Holdings Fund Llc
Purchase Details
Closed on
Jul 10, 2020
Sold by
Roggenkamp Properties Llc
Bought by
Althoff Investments Llc
Home Financials for this Owner
Home Financials are based on the most recent Mortgage that was taken out on this home.
Original Mortgage
$72,560
Interest Rate
3.1%
Mortgage Type
Future Advance Clause Open End Mortgage
Purchase Details
Closed on
Feb 11, 2016
Sold by
Roggenkamp Allan and Roggenkamp Jeanne
Bought by
Roggenkamp Properties Llc
Purchase Details
Closed on
Jul 30, 2010
Sold by
Bank Of York
Bought by
Rogerkamp Allan and Rogerkamp Jeanne
Purchase Details
Closed on
Dec 2, 2009
Sold by
Nesemeier Kathleen and Nesemeier Fred E
Bought by
Bank Of New York
Create a Home Valuation Report for This Property
The Home Valuation Report is an in-depth analysis detailing your home's value as well as a comparison with similar homes in the area
Home Values in the Area
Average Home Value in this Area
Purchase History
| Date | Buyer | Sale Price | Title Company |
|---|---|---|---|
| Whiskey Birdie Llc | -- | Fm Title | |
| River City Holdings Fund Llc | $118,000 | Title Company Residential | |
| Althoff Investments Llc | $90,700 | Regency Title | |
| Roggenkamp Properties Llc | $91,250 | Title Fargo | |
| Rogerkamp Allan | -- | -- | |
| Bank Of New York | $108,932 | -- | |
| Bank Of New York | $108,932 | -- |
Source: Public Records
Mortgage History
| Date | Status | Borrower | Loan Amount |
|---|---|---|---|
| Previous Owner | Althoff Investments Llc | $72,560 |
Source: Public Records
Tax History
| Year | Tax Paid | Tax Assessment Tax Assessment Total Assessment is a certain percentage of the fair market value that is determined by local assessors to be the total taxable value of land and additions on the property. | Land | Improvement |
|---|---|---|---|---|
| 2024 | $2,307 | $72,750 | $17,550 | $55,200 |
| 2023 | $2,204 | $69,300 | $17,550 | $51,750 |
| 2022 | $2,112 | $64,750 | $17,550 | $47,200 |
| 2021 | $1,922 | $58,850 | $17,550 | $41,300 |
| 2020 | $1,902 | $58,850 | $17,550 | $41,300 |
| 2019 | $2,025 | $63,450 | $8,150 | $55,300 |
| 2018 | $2,003 | $63,450 | $8,150 | $55,300 |
| 2017 | $1,553 | $60,450 | $8,150 | $52,300 |
| 2016 | $1,383 | $58,700 | $8,150 | $50,550 |
| 2015 | $1,478 | $58,800 | $6,900 | $51,900 |
| 2014 | $1,378 | $53,450 | $6,900 | $46,550 |
| 2013 | $689 | $53,450 | $6,900 | $46,550 |
Source: Public Records
Map
Nearby Homes
- 714 Oak St N
- 727 3rd St N
- 505 Oak St N Unit 511
- 505 Oak St N Unit 502
- 505 Oak St N Unit 503
- 505 Oak St N Unit 504
- 505 Oak St N Unit 506
- 505 Oak St N Unit 514
- 505 Oak St N Unit 501
- 505 Oak St N Unit 513
- 730 Elm St N Unit B1
- 804 3rd St N
- 601 5th St N
- 902-904 N 1st Street North St N
- 34 South Terrace N
- 200 4th Ave N Unit 201
- 412 5th St N Unit 524
- 921 4th St N
- 319 Broadway N Unit 202
- 105 3rd St N Unit 603
Your Personal Tour Guide
Ask me questions while you tour the home.