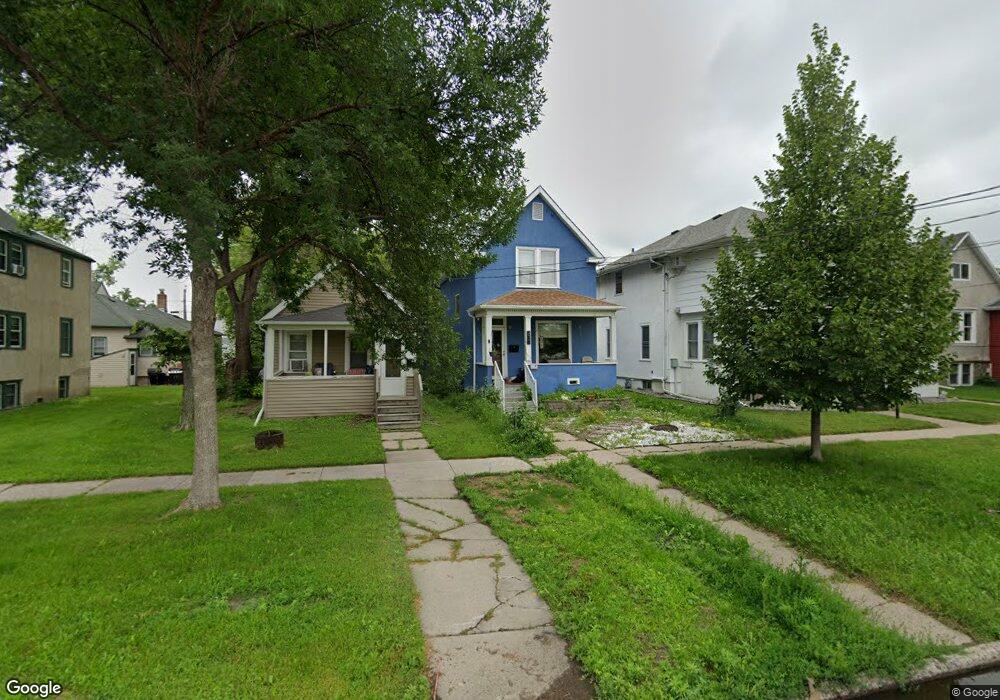
613 3rd St N Fargo, ND 58102
Horace Mann NeighborhoodEstimated Value: $150,554 - $250,000
2
Beds
1
Bath
1,144
Sq Ft
$172/Sq Ft
Est. Value
About This Home
This home is located at 613 3rd St N, Fargo, ND 58102 and is currently estimated at $196,389, approximately $171 per square foot. 613 3rd St N is a home located in Cass County with nearby schools including Horace Mann Roosevelt Elementary School, Ben Franklin Middle School, and North High School.
Ownership History
Date
Name
Owned For
Owner Type
Purchase Details
Closed on
Mar 7, 2016
Sold by
Manning Jessica A
Bought by
Manning Jessica A and Sperling Noah
Current Estimated Value
Home Financials for this Owner
Home Financials are based on the most recent Mortgage that was taken out on this home.
Original Mortgage
$115,862
Outstanding Balance
$92,314
Interest Rate
4.5%
Mortgage Type
FHA
Estimated Equity
$104,075
Purchase Details
Closed on
Feb 4, 2016
Sold by
Daeuber Jana B and Daeuber Benjamin
Bought by
Manning Jessica M
Home Financials for this Owner
Home Financials are based on the most recent Mortgage that was taken out on this home.
Original Mortgage
$115,862
Outstanding Balance
$92,314
Interest Rate
4.5%
Mortgage Type
FHA
Estimated Equity
$104,075
Create a Home Valuation Report for This Property
The Home Valuation Report is an in-depth analysis detailing your home's value as well as a comparison with similar homes in the area
Home Values in the Area
Average Home Value in this Area
Purchase History
We collect this data history from publicly available records. To have your information removed, we recommend requesting removal directly through your county’s website.
| Date | Buyer | Sale Price | Title Company |
|---|---|---|---|
| Manning Jessica A | -- | Fm Title | |
| Manning Jessica M | $118,000 | Fm Title |
Source: Public Records
Mortgage History
We collect this data history from publicly available records. To have your information removed, we recommend requesting removal directly through your county’s website.
| Date | Status | Borrower | Loan Amount |
|---|---|---|---|
| Open | Manning Jessica M | $115,862 |
Source: Public Records
Tax History
| Year | Tax Paid | Tax Assessment Tax Assessment Total Assessment is a certain percentage of the fair market value that is determined by local assessors to be the total taxable value of land and additions on the property. | Land | Improvement |
|---|---|---|---|---|
| 2025 | $3,173 | $73,200 | $5,600 | $67,600 |
| 2024 | $1,921 | $65,350 | $5,600 | $59,750 |
| 2023 | $1,845 | $62,850 | $5,600 | $57,250 |
| 2022 | $1,718 | $57,150 | $5,600 | $51,550 |
| 2021 | $1,704 | $55,500 | $5,600 | $49,900 |
| 2020 | $1,606 | $55,500 | $5,600 | $49,900 |
| 2019 | $1,755 | $61,100 | $2,600 | $58,500 |
| 2018 | $1,695 | $61,100 | $2,600 | $58,500 |
| 2017 | $1,495 | $58,200 | $2,600 | $55,600 |
| 2016 | $1,331 | $56,500 | $2,600 | $53,900 |
| 2015 | $1,279 | $50,900 | $2,200 | $48,700 |
| 2014 | $1,182 | $45,850 | $2,200 | $43,650 |
| 2013 | $1,148 | $44,500 | $2,200 | $42,300 |
Source: Public Records
Map
Nearby Homes
- 609 3rd St N
- 618 Oak St N
- 714 Oak St N
- 200 4th Ave N Unit 201
- 412 5th St N Unit 526
- 10 7th Ave N
- 505 Oak St N Unit 511
- 505 Oak St N Unit 512
- 505 Oak St N Unit 509
- 505 Oak St N Unit 502
- 505 Oak St N Unit 503
- 505 Oak St N Unit 504
- 505 Oak St N Unit 506
- 505 Oak St N Unit 514
- 505 Oak St N Unit 501
- 505 Oak St N Unit 513
- 730 Elm St N Unit B1
- 902-904 N 1st Street North St N
- 319 Broadway N Unit 202
- 319 Broadway N Unit 305
Your Personal Tour Guide
Ask me questions while you tour the home.