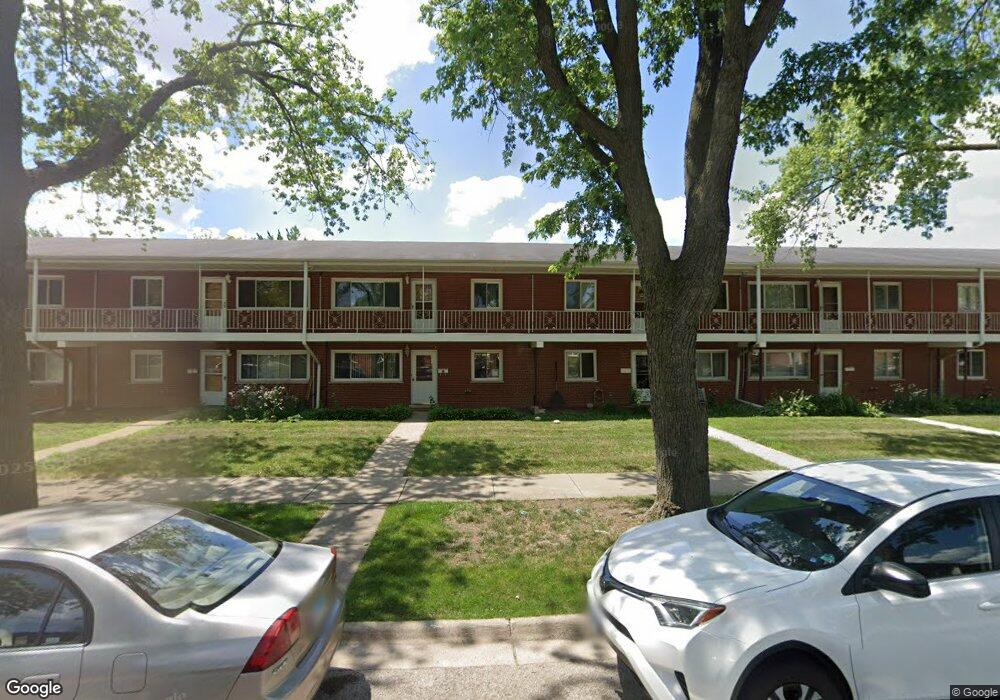
613 Dulles Rd Unit 613A Des Plaines, IL 60016
Estimated Value: $161,629 - $191,000
2
Beds
--
Bath
900
Sq Ft
$196/Sq Ft
Est. Value
About This Home
This home is located at 613 Dulles Rd Unit 613A, Des Plaines, IL 60016 and is currently estimated at $176,657, approximately $196 per square foot. 613 Dulles Rd Unit 613A is a home located in Cook County with nearby schools including Brentwood Elementary School, Friendship Jr High School, and Elk Grove High School.
Ownership History
Date
Name
Owned For
Owner Type
Purchase Details
Closed on
Feb 5, 2026
Sold by
Sanchez Delfino Morales and Sanchez Cirilo Morales
Bought by
Sanchez Cirilo Morales and Sanchez Osvelia
Current Estimated Value
Home Financials for this Owner
Home Financials are based on the most recent Mortgage that was taken out on this home.
Original Mortgage
$90,800
Outstanding Balance
$90,800
Interest Rate
6.88%
Mortgage Type
New Conventional
Estimated Equity
$85,857
Purchase Details
Closed on
Nov 29, 2007
Sold by
Sanchez Delfino Morales
Bought by
Sanchez Delfino Morales and Sanchez Cirilo
Purchase Details
Closed on
Oct 31, 2003
Sold by
Obrien Nimrod Jr Joseph and Obrien Nimrod Ann
Bought by
Sanchez Delfino Morales
Home Financials for this Owner
Home Financials are based on the most recent Mortgage that was taken out on this home.
Original Mortgage
$121,410
Interest Rate
6.01%
Mortgage Type
Unknown
Purchase Details
Closed on
Jun 30, 2003
Sold by
Orchid Investment Co Inc
Bought by
Obrien Nimrod Jr Joseph and Obrien Nimrod Ann
Purchase Details
Closed on
May 20, 2003
Sold by
Crane Edgar
Bought by
Orchid Investment Co
Create a Home Valuation Report for This Property
The Home Valuation Report is an in-depth analysis detailing your home's value as well as a comparison with similar homes in the area
Home Values in the Area
Average Home Value in this Area
Purchase History
| Date | Buyer | Sale Price | Title Company |
|---|---|---|---|
| Sanchez Cirilo Morales | -- | None Listed On Document | |
| Sanchez Delfino Morales | -- | Accommodation | |
| Sanchez Delfino Morales | -- | -- | |
| Obrien Nimrod Jr Joseph | $108,000 | -- | |
| Orchid Investment Co | $105,000 | -- |
Source: Public Records
Mortgage History
| Date | Status | Borrower | Loan Amount |
|---|---|---|---|
| Open | Sanchez Cirilo Morales | $90,800 | |
| Previous Owner | Sanchez Delfino Morales | $121,410 | |
| Closed | Sanchez Delfino Morales | $6,500 |
Source: Public Records
Tax History
| Year | Tax Paid | Tax Assessment Tax Assessment Total Assessment is a certain percentage of the fair market value that is determined by local assessors to be the total taxable value of land and additions on the property. | Land | Improvement |
|---|---|---|---|---|
| 2025 | $2,214 | $15,500 | $3,305 | $12,195 |
| 2024 | $2,214 | $12,056 | $2,833 | $9,223 |
| 2023 | $2,092 | $12,056 | $2,833 | $9,223 |
| 2022 | $2,092 | $12,056 | $2,833 | $9,223 |
| 2021 | $1,823 | $9,893 | $1,888 | $8,005 |
| 2020 | $1,845 | $9,893 | $1,888 | $8,005 |
| 2019 | $1,884 | $11,052 | $1,888 | $9,164 |
| 2018 | $977 | $6,930 | $1,573 | $5,357 |
| 2017 | $975 | $6,930 | $1,573 | $5,357 |
| 2016 | $1,144 | $6,930 | $1,573 | $5,357 |
| 2015 | $1,632 | $8,544 | $1,416 | $7,128 |
| 2014 | $2,328 | $8,544 | $1,416 | $7,128 |
| 2013 | $2,279 | $8,544 | $1,416 | $7,128 |
Source: Public Records
Map
Nearby Homes
- 633 Dulles Rd Unit A
- 380 Dulles Rd
- 909 S Emerson St
- 756 W Millers Rd
- 381 W Millers Rd
- 915 S Owen St
- 601 W Huntington Commons Rd Unit 202
- 304 E Hiawatha Trail
- 407 E Berkshire Ln
- 170 Westmere Rd
- 301 Lance Dr
- 901 S Can Dota Ave
- 725 W Huntington Commons Rd Unit 401
- 147 Lance Dr
- 930 Beau Dr Unit 312
- 866 Clark Ln
- 1100 S Church Rd
- 960 Beau Dr Unit 109
- 650 Murray Ln Unit 214
- 650 Murray Ln Unit 314
- 613 Dulles Rd Unit B
- 613 Dulles Rd Unit 613B
- 617 Dulles Rd Unit 617B
- 617 Dulles Rd Unit 617A
- 617 Dulles Rd Unit B
- 621 Dulles Rd Unit 621B
- 621 Dulles Rd Unit 621A
- 621 Dulles Rd Unit A
- 609 Dulles Rd Unit 609B
- 609 Dulles Rd Unit 609A
- 609 Dulles Rd Unit B
- 629 Dulles Rd Unit 629B
- 629 Dulles Rd Unit 629A
- 629 Dulles Rd Unit B
- 625 Dulles Rd Unit 625B
- 625 Dulles Rd Unit 625A
- 371 Beau Dr
- 633 Dulles Rd Unit 633B
- 633 Dulles Rd Unit 633A
- 557 Dulles Rd
Your Personal Tour Guide
Ask me questions while you tour the home.