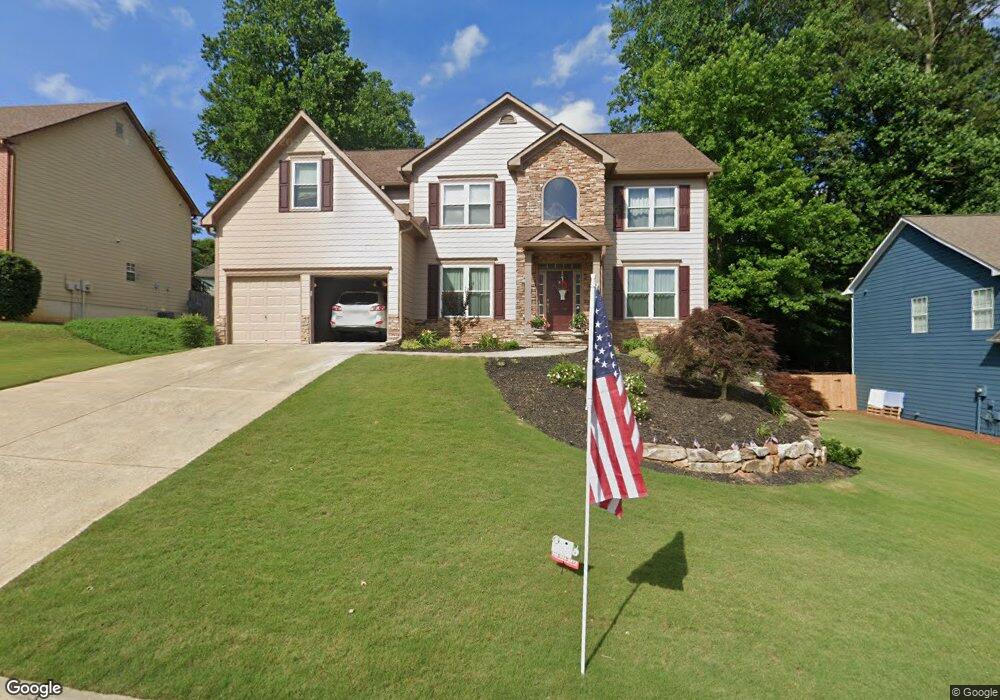
613 Garnet Ct Canton, GA 30114
Oak Grove NeighborhoodEstimated Value: $547,592 - $569,000
4
Beds
3
Baths
2,966
Sq Ft
$188/Sq Ft
Est. Value
About This Home
This home is located at 613 Garnet Ct, Canton, GA 30114 and is currently estimated at $558,296, approximately $188 per square foot. 613 Garnet Ct is a home located in Cherokee County with nearby schools including Sixes Elementary School, Freedom Middle School, and Woodstock High School.
Ownership History
Date
Name
Owned For
Owner Type
Purchase Details
Closed on
May 11, 2021
Sold by
Korb Kelly Marie
Bought by
Korb Kelly Marie and Korb Martin Ashton
Current Estimated Value
Purchase Details
Closed on
Jun 11, 2012
Sold by
Neeley David Alan
Bought by
Neeley Kelly W
Purchase Details
Closed on
Apr 20, 2007
Sold by
Snyder Chad and Snyder Penny
Bought by
Neeley David A and Neeley Kelly W
Home Financials for this Owner
Home Financials are based on the most recent Mortgage that was taken out on this home.
Original Mortgage
$259,706
Interest Rate
6.1%
Mortgage Type
VA
Purchase Details
Closed on
Sep 28, 2001
Sold by
Mccar Development Corp
Bought by
Snyder Chad and Snyder Penny
Home Financials for this Owner
Home Financials are based on the most recent Mortgage that was taken out on this home.
Original Mortgage
$226,250
Interest Rate
6.87%
Mortgage Type
New Conventional
Create a Home Valuation Report for This Property
The Home Valuation Report is an in-depth analysis detailing your home's value as well as a comparison with similar homes in the area
Home Values in the Area
Average Home Value in this Area
Purchase History
| Date | Buyer | Sale Price | Title Company |
|---|---|---|---|
| Korb Kelly Marie | -- | -- | |
| Neeley Kelly W | -- | -- | |
| Neeley David A | $285,000 | -- | |
| Snyder Chad | $238,300 | -- |
Source: Public Records
Mortgage History
| Date | Status | Borrower | Loan Amount |
|---|---|---|---|
| Previous Owner | Neeley David A | $259,706 | |
| Previous Owner | Snyder Chad | $226,250 |
Source: Public Records
Tax History
| Year | Tax Paid | Tax Assessment Tax Assessment Total Assessment is a certain percentage of the fair market value that is determined by local assessors to be the total taxable value of land and additions on the property. | Land | Improvement |
|---|---|---|---|---|
| 2025 | $4,788 | $203,556 | $41,200 | $162,356 |
| 2024 | $4,862 | $208,796 | $44,800 | $163,996 |
| 2023 | $4,331 | $204,240 | $41,600 | $162,640 |
| 2022 | $3,924 | $162,040 | $32,000 | $130,040 |
| 2021 | $3,782 | $141,880 | $26,640 | $115,240 |
| 2020 | $3,488 | $129,080 | $24,000 | $105,080 |
| 2019 | $3,208 | $117,040 | $20,800 | $96,240 |
| 2018 | $3,127 | $112,800 | $20,800 | $92,000 |
| 2017 | $3,019 | $267,900 | $20,800 | $86,360 |
| 2016 | $2,778 | $244,300 | $20,800 | $76,920 |
| 2015 | $2,569 | $224,200 | $20,800 | $68,880 |
| 2014 | $2,485 | $216,600 | $20,800 | $65,840 |
Source: Public Records
Map
Nearby Homes
- 325 Gold Ridge
- 641 E Shore Dr
- 0 Sixes Creek Trail Unit 7197452
- 1600 Sixes Rd
- 187 Sixes Creek Trail
- 190 Sixes Creek Trail
- 206 Sawtooth Ct
- 423 Crestmont Ln
- 417 Crestmont Ln
- 2785 Sixes Rd
- 1012 Blankets Creek Dr
- 517 Kensington Park Dr Unit 3
- 207 Springs Crossing
- 2550 Mountain Brook Rd
- 103 Prominence Ct
- 779 Holly St
- 1520 Timber Trace
- 1415 Sixes Rd
- 151 Prominence Ct
- 305 Ridge Rd
- 611 Garnet Ct
- 615 Garnet Ct
- 609 Garnet Ct Unit 3
- 1092 Copper Creek Dr
- 617 Garnet Ct Unit 3
- 704 Lake Side Ln Unit 3
- 1090 Copper Creek Dr
- 612 Garnet Ct Unit 3
- 614 Garnet Ct Unit 3
- 610 Garnet Ct
- 700 Lake Side Ln
- 1088 Copper Creek Dr Unit 3
- 608 Garnet Ct
- 706 Lake Side Ln
- 616 Garnet Ct Unit 3
- 1086 Copper Creek Dr Unit 3
- 619 Garnet Ct Unit 3
- 442 Lakeside Overlook
- 466 Lakeside Overlook Dr
- 454 Lakeside Overlook Dr
Your Personal Tour Guide
Ask me questions while you tour the home.