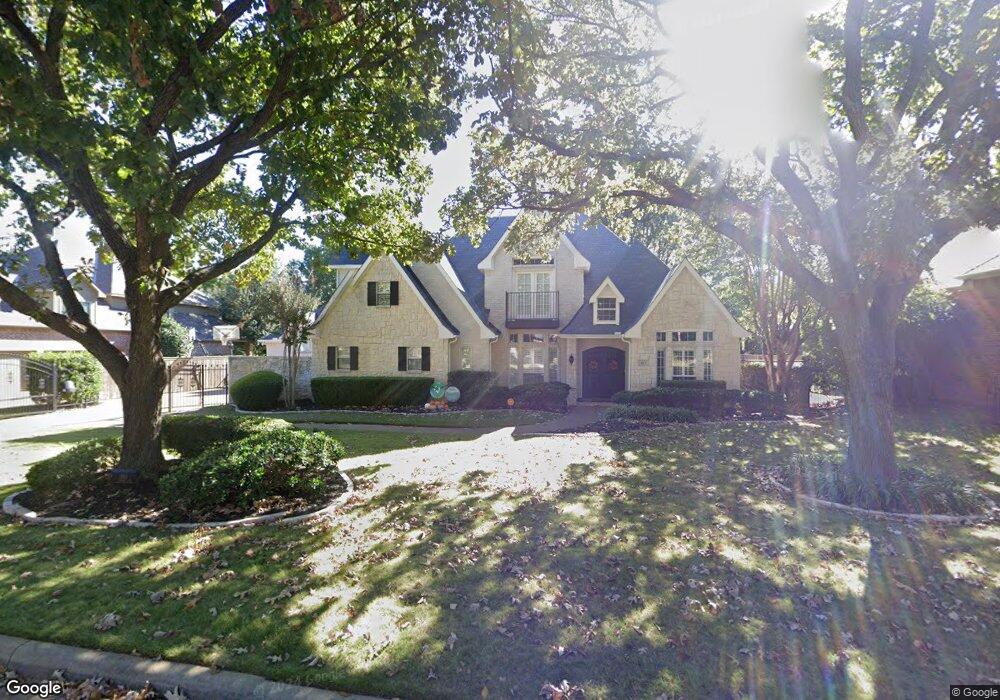
613 Logans Ln Southlake, TX 76092
Estimated Value: $1,428,950 - $1,802,000
5
Beds
4
Baths
4,365
Sq Ft
$361/Sq Ft
Est. Value
About This Home
This home is located at 613 Logans Ln, Southlake, TX 76092 and is currently estimated at $1,575,488, approximately $360 per square foot. 613 Logans Ln is a home located in Tarrant County with nearby schools including Old Union Elementary School, Eubanks Intermediate School, and George Dawson Middle School.
Ownership History
Date
Name
Owned For
Owner Type
Purchase Details
Closed on
Jul 15, 2013
Sold by
Vale Steven E and Vale Lori A
Bought by
Baker Ryan C and Baker Leilani
Current Estimated Value
Home Financials for this Owner
Home Financials are based on the most recent Mortgage that was taken out on this home.
Original Mortgage
$617,625
Outstanding Balance
$449,484
Interest Rate
3.94%
Mortgage Type
VA
Estimated Equity
$1,126,004
Purchase Details
Closed on
Jun 28, 1999
Sold by
Hendrickson Ruben and Hendrickson Laurie C
Bought by
Vale Steven E and Vale Lori A
Home Financials for this Owner
Home Financials are based on the most recent Mortgage that was taken out on this home.
Original Mortgage
$240,000
Interest Rate
7.63%
Purchase Details
Closed on
Aug 28, 1997
Sold by
Pierce Homes Inc
Bought by
Hendrickson Ruben and Hendrickson Laurie C
Home Financials for this Owner
Home Financials are based on the most recent Mortgage that was taken out on this home.
Original Mortgage
$326,000
Interest Rate
6.5%
Purchase Details
Closed on
Mar 20, 1997
Sold by
Westerra Timarron Lp
Bought by
Pierce Homes Inc
Create a Home Valuation Report for This Property
The Home Valuation Report is an in-depth analysis detailing your home's value as well as a comparison with similar homes in the area
Home Values in the Area
Average Home Value in this Area
Purchase History
| Date | Buyer | Sale Price | Title Company |
|---|---|---|---|
| Baker Ryan C | -- | None Available | |
| Vale Steven E | -- | First American Title Co | |
| Hendrickson Ruben | -- | Ticor Title | |
| Pierce Homes Inc | -- | Stewart Title |
Source: Public Records
Mortgage History
| Date | Status | Borrower | Loan Amount |
|---|---|---|---|
| Open | Baker Ryan C | $617,625 | |
| Previous Owner | Vale Steven E | $240,000 | |
| Previous Owner | Hendrickson Ruben | $326,000 |
Source: Public Records
Tax History Compared to Growth
Tax History
| Year | Tax Paid | Tax Assessment Tax Assessment Total Assessment is a certain percentage of the fair market value that is determined by local assessors to be the total taxable value of land and additions on the property. | Land | Improvement |
|---|---|---|---|---|
| 2025 | $18,362 | $1,328,630 | $250,000 | $1,078,630 |
| 2024 | $18,362 | $1,328,630 | $250,000 | $1,078,630 |
| 2023 | $19,852 | $1,382,037 | $250,000 | $1,132,037 |
| 2022 | $21,362 | $990,181 | $185,000 | $805,181 |
| 2021 | $21,295 | $933,991 | $185,000 | $748,991 |
| 2020 | $20,443 | $937,512 | $185,000 | $752,512 |
| 2019 | $19,578 | $808,499 | $185,000 | $623,499 |
| 2018 | $19,353 | $799,213 | $185,000 | $614,213 |
| 2017 | $19,735 | $796,207 | $185,000 | $611,207 |
| 2016 | $19,420 | $783,493 | $185,000 | $598,493 |
| 2015 | $15,113 | $760,658 | $125,000 | $635,658 |
| 2014 | $15,113 | $603,700 | $75,000 | $528,700 |
Source: Public Records
Map
Nearby Homes
- 1227 Strathmore Dr
- 710 Longford Dr
- 708 Nettleton Dr
- 608 Regency Crossing
- 1420 Kensington Ct
- 521 Regency Crossing
- 712 Ashleigh Ln
- 1100 La Paloma Ct
- 1012 Cool River Dr
- 7312 Hix Ct
- 7322 Calloway Ct
- 7316 Calloway Ct
- 1417 Nottoway Ct
- 1418 Nottoway Ct
- 1406 Nottoway Ct
- 7255 Oak Alley Dr
- 802 Princeton Ct
- 221 Pine Dr
- 7200 Belle Meade Dr
- 7106 Belle Meade Dr
- 611 Logans Ln
- 615 Logans Ln
- 610 Aberdeen Way
- 612 Aberdeen Way
- 609 Logans Ln
- 617 Logans Ln
- 614 Aberdeen Way
- 612 Logans Ln
- 610 Logans Ln
- 608 Aberdeen Way
- 614 Logans Ln
- 616 Aberdeen Way
- 608 Logans Ln
- 607 Logans Ln
- 618 Aberdeen Way
- 606 Aberdeen Way
- 616 Logans Ln
- 606 Logans Ln
- 620 Aberdeen Way
- 607 Aberdeen Way