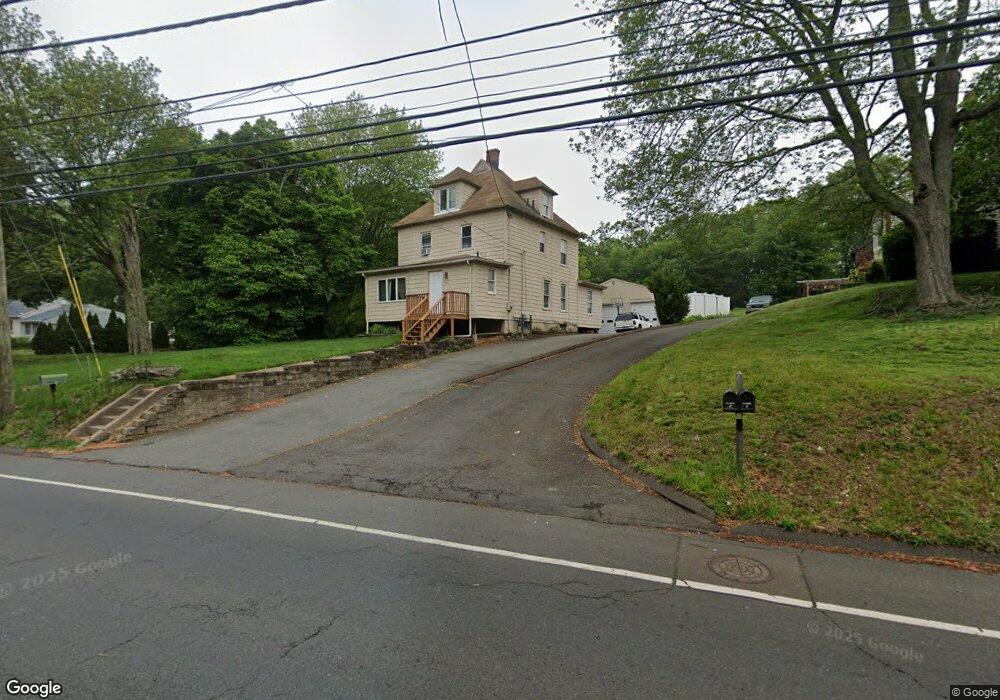
613 Main St West Haven, CT 06516
West Haven Center NeighborhoodEstimated Value: $411,396 - $464,000
3
Beds
2
Baths
2,001
Sq Ft
$218/Sq Ft
Est. Value
About This Home
This home is located at 613 Main St, West Haven, CT 06516 and is currently estimated at $435,599, approximately $217 per square foot. 613 Main St is a home located in New Haven County with nearby schools including Carrigan 5/6 Intermediate School, Harry M. Bailey Middle School, and West Haven High School.
Ownership History
Date
Name
Owned For
Owner Type
Purchase Details
Closed on
Dec 19, 2019
Sold by
Fhlm
Bought by
Lyons Robert M
Current Estimated Value
Purchase Details
Closed on
Aug 19, 2019
Sold by
M & T Bank Na
Bought by
Fhlm
Purchase Details
Closed on
Jul 22, 2019
Sold by
Oneman Financial Svc and M & T Bank Na
Bought by
M & T Bank Na
Purchase Details
Closed on
Dec 2, 2016
Sold by
Clark Marilyn S
Bought by
Hemming Craig R and Lyons Robert M
Purchase Details
Closed on
Feb 15, 1983
Bought by
Hemming Craig R
Create a Home Valuation Report for This Property
The Home Valuation Report is an in-depth analysis detailing your home's value as well as a comparison with similar homes in the area
Home Values in the Area
Average Home Value in this Area
Purchase History
| Date | Buyer | Sale Price | Title Company |
|---|---|---|---|
| Lyons Robert M | $93,007 | None Available | |
| Lyons Robert M | $93,007 | None Available | |
| Fhlm | -- | -- | |
| Fhlm | -- | -- | |
| M & T Bank Na | $130,021 | -- | |
| M & T Bank Na | $130,021 | -- | |
| Hemming Craig R | $16,500 | -- | |
| Hemming Craig R | -- | -- | |
| Hemming Craig R | $16,500 | -- |
Source: Public Records
Mortgage History
| Date | Status | Borrower | Loan Amount |
|---|---|---|---|
| Previous Owner | Hemming Craig R | $65,605 | |
| Previous Owner | Hemming Craig R | $65,604 | |
| Previous Owner | Hemming Craig R | $40,000 |
Source: Public Records
Tax History
| Year | Tax Paid | Tax Assessment Tax Assessment Total Assessment is a certain percentage of the fair market value that is determined by local assessors to be the total taxable value of land and additions on the property. | Land | Improvement |
|---|---|---|---|---|
| 2025 | $8,888 | $257,390 | $76,300 | $181,090 |
| 2024 | $7,866 | $162,120 | $52,850 | $109,270 |
| 2023 | $7,540 | $162,120 | $52,850 | $109,270 |
| 2022 | $7,393 | $162,120 | $52,850 | $109,270 |
| 2021 | $7,393 | $162,120 | $52,850 | $109,270 |
| 2020 | $7,348 | $145,600 | $48,650 | $96,950 |
| 2019 | $7,086 | $145,600 | $48,650 | $96,950 |
| 2018 | $7,025 | $145,600 | $48,650 | $96,950 |
| 2017 | $6,648 | $145,600 | $48,650 | $96,950 |
| 2016 | $6,634 | $145,600 | $48,650 | $96,950 |
| 2015 | $6,400 | $158,620 | $52,220 | $106,400 |
| 2014 | $6,361 | $158,620 | $52,220 | $106,400 |
Source: Public Records
Map
Nearby Homes
- 52 Saw Mill Rd
- 166 Saw Mill Rd
- 51 Woody Ln
- 16 Sorensen Rd
- 292 Richmond Ave
- 40 Sorensen Rd
- 70 Edward St
- 327 Center St
- 44 Church St
- 5 W Prospect St
- 350 Campbell Ave
- 12 Linda St
- 155 Leete St
- 307R Washington Ave
- 246 Elm St
- 285 Main St
- 330 Savin Ave Unit 76
- 330 Savin Ave Unit 32
- 30 Washington Manor Ave
- 248 William St
Your Personal Tour Guide
Ask me questions while you tour the home.