Estimated Value: $103,000 - $139,000
3
Beds
--
Bath
1,400
Sq Ft
$83/Sq Ft
Est. Value
About This Home
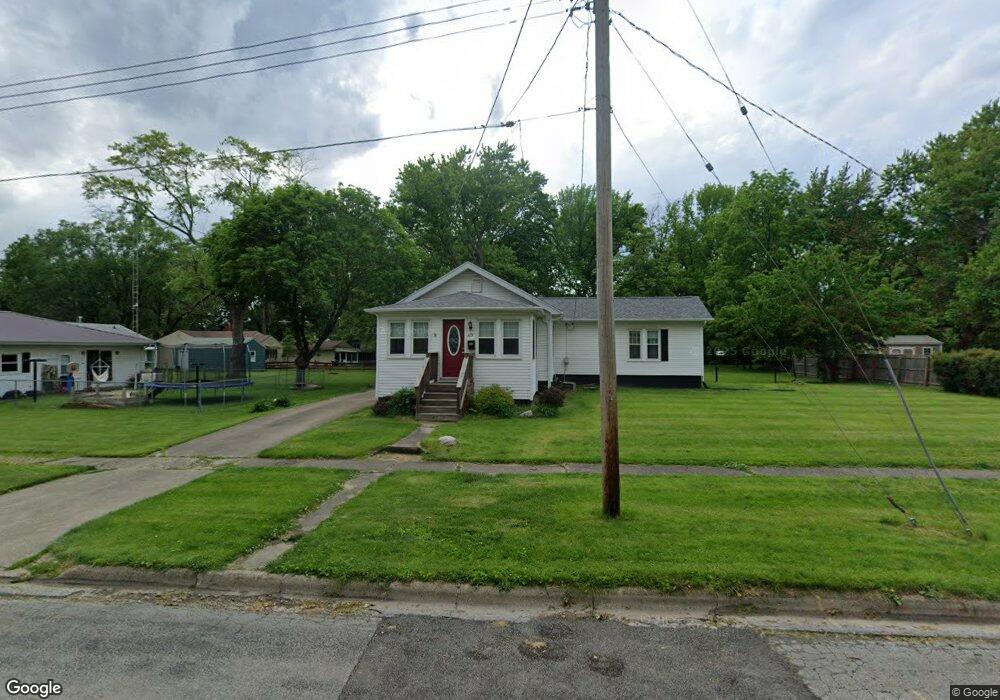
This home is located at 613 Maple St, Pana, IL 62557 and is currently estimated at $116,761, approximately $83 per square foot. 613 Maple St is a home located in Christian County with nearby schools including Washington Elementary School, Lincoln Elementary School, and Pana Jr High School.
Ownership History
Date
Name
Owned For
Owner Type
Purchase Details
Closed on
Nov 19, 2012
Sold by
Paschall Keri A and Miller Keri A
Bought by
Miller Timothy M
Current Estimated Value
Home Financials for this Owner
Home Financials are based on the most recent Mortgage that was taken out on this home.
Original Mortgage
$79,591
Outstanding Balance
$55,594
Interest Rate
3.62%
Mortgage Type
New Conventional
Estimated Equity
$61,167
Purchase Details
Closed on
Jul 16, 2008
Sold by
Arnold Linda S
Bought by
Miller Timothy M and Miller Keri A
Home Financials for this Owner
Home Financials are based on the most recent Mortgage that was taken out on this home.
Original Mortgage
$75,500
Interest Rate
6.15%
Mortgage Type
New Conventional
Purchase Details
Closed on
Mar 6, 2007
Sold by
Casner Geraldine A
Bought by
Casner Geraldine A and Arnold Linda S
Create a Home Valuation Report for This Property
The Home Valuation Report is an in-depth analysis detailing your home's value as well as a comparison with similar homes in the area
Home Values in the Area
Average Home Value in this Area
Purchase History
| Date | Buyer | Sale Price | Title Company |
|---|---|---|---|
| Miller Timothy M | -- | None Available | |
| Miller Timothy M | $72,000 | Advanced Title Group Inc | |
| Casner Geraldine A | -- | None Available |
Source: Public Records
Mortgage History
| Date | Status | Borrower | Loan Amount |
|---|---|---|---|
| Open | Miller Timothy M | $79,591 | |
| Closed | Miller Timothy M | $75,500 |
Source: Public Records
Tax History
| Year | Tax Paid | Tax Assessment Tax Assessment Total Assessment is a certain percentage of the fair market value that is determined by local assessors to be the total taxable value of land and additions on the property. | Land | Improvement |
|---|---|---|---|---|
| 2024 | $2,090 | $27,515 | $6,350 | $21,165 |
| 2023 | $1,974 | $25,997 | $6,000 | $19,997 |
| 2022 | $1,874 | $24,264 | $5,956 | $18,308 |
| 2021 | $1,822 | $23,788 | $5,839 | $17,949 |
| 2020 | $1,747 | $22,779 | $5,591 | $17,188 |
| 2019 | $1,773 | $23,316 | $5,723 | $17,593 |
| 2018 | $1,716 | $22,826 | $5,595 | $17,231 |
| 2017 | $1,739 | $23,292 | $5,709 | $17,583 |
| 2016 | $1,719 | $23,227 | $5,693 | $17,534 |
| 2015 | $1,709 | $22,957 | $5,626 | $17,331 |
| 2014 | $1,687 | $21,353 | $5,233 | $16,120 |
| 2013 | $1,691 | $22,658 | $5,233 | $17,425 |
| 2011 | $1,677 | $23,194 | $5,357 | $17,837 |
Source: Public Records
Map
Nearby Homes
- 604 Kitchell St
- 610 Cherry St
- 707 Kitchell St
- 410 E 9th St
- 308 Kitchell St
- 305 S Spruce St
- 613 E 5th St
- 117 Macarthur Blvd
- 516 S Oak St
- 801 E 6th St
- 800 Progress St
- 506 S Chestnut St
- 502 S Chestnut St
- 504 S Chestnut St
- 701 E 3rd St
- 514 S Walnut St
- 300 E 2nd St
- 203 S Walnut St
- 906 Birch St
- 9 W 2nd St
Your Personal Tour Guide
Ask me questions while you tour the home.