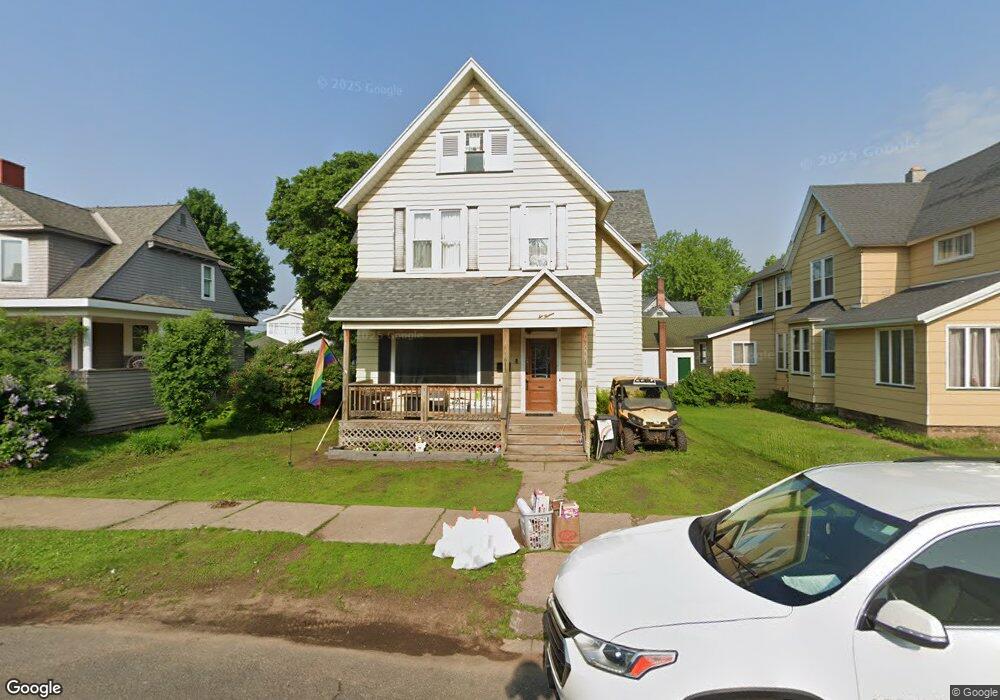
613 N 4th St Ishpeming, MI 49849
Estimated Value: $152,000 - $211,000
4
Beds
1
Bath
2,428
Sq Ft
$78/Sq Ft
Est. Value
About This Home
This home is located at 613 N 4th St, Ishpeming, MI 49849 and is currently estimated at $188,355, approximately $77 per square foot. 613 N 4th St is a home located in Marquette County with nearby schools including Birchview School, Ishpeming Middle School, and Ishpeming High School.
Ownership History
Date
Name
Owned For
Owner Type
Purchase Details
Closed on
Jun 27, 2023
Sold by
Loman Anne K
Bought by
Yoho Paige
Current Estimated Value
Home Financials for this Owner
Home Financials are based on the most recent Mortgage that was taken out on this home.
Original Mortgage
$109,610
Outstanding Balance
$106,887
Interest Rate
6.57%
Mortgage Type
New Conventional
Estimated Equity
$81,468
Purchase Details
Closed on
Apr 23, 1998
Bought by
Loman Anne
Create a Home Valuation Report for This Property
The Home Valuation Report is an in-depth analysis detailing your home's value as well as a comparison with similar homes in the area
Home Values in the Area
Average Home Value in this Area
Purchase History
| Date | Buyer | Sale Price | Title Company |
|---|---|---|---|
| Yoho Paige | $113,000 | None Listed On Document | |
| Loman Anne | $53,000 | -- |
Source: Public Records
Mortgage History
| Date | Status | Borrower | Loan Amount |
|---|---|---|---|
| Open | Yoho Paige | $109,610 |
Source: Public Records
Tax History
| Year | Tax Paid | Tax Assessment Tax Assessment Total Assessment is a certain percentage of the fair market value that is determined by local assessors to be the total taxable value of land and additions on the property. | Land | Improvement |
|---|---|---|---|---|
| 2025 | $1,783 | $76,750 | $0 | $0 |
| 2024 | $17 | $74,950 | $0 | $0 |
| 2023 | $457 | $59,550 | $0 | $0 |
| 2022 | $2,019 | $46,900 | $0 | $0 |
| 2021 | $1,943 | $49,000 | $0 | $0 |
| 2020 | $1,902 | $46,900 | $0 | $0 |
| 2019 | $1,871 | $42,600 | $0 | $0 |
| 2018 | $1,815 | $43,800 | $0 | $0 |
| 2017 | $1,766 | $43,700 | $0 | $0 |
| 2016 | $1,707 | $42,350 | $0 | $0 |
| 2015 | -- | $42,350 | $0 | $0 |
| 2014 | -- | $44,250 | $0 | $0 |
| 2012 | -- | $46,050 | $0 | $0 |
Source: Public Records
Map
Nearby Homes
- 635 N 5th St
- 408 E Empire St
- 612 Maurice St
- 818 N Pine St
- 401 Cleveland Ave
- 113 N 2nd St
- 200 W Ridge St
- 312 W Ridge St
- 114 E Superior St
- TBD Us Highway 41
- 645 Palms Ave
- 684 Mather Ave
- 242 Hill St
- 258 Hill St
- 2009 Deer Lake Ave
- 2115 Deer Lake Ave
- 1071 & 1075 Highland Dr
- 208 Shoreline Dr
- 162 Saginaw St
- 349 Us Highway 41
Your Personal Tour Guide
Ask me questions while you tour the home.