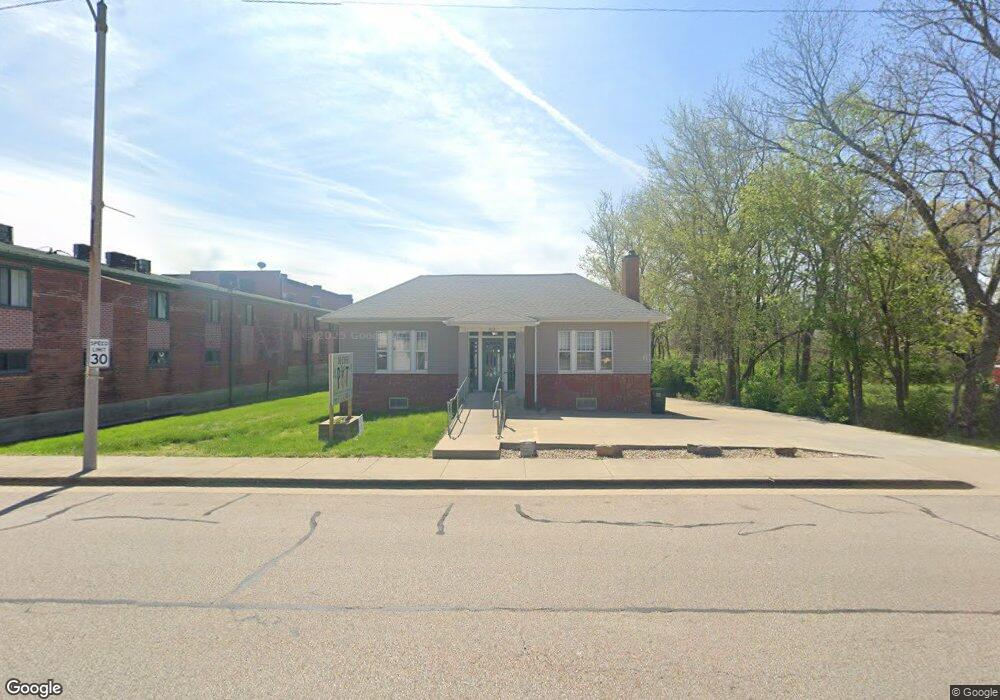
613 N Main St Columbia, IL 62236
Estimated Value: $244,000 - $336,000
2
Beds
--
Bath
1,360
Sq Ft
$217/Sq Ft
Est. Value
About This Home
This home is located at 613 N Main St, Columbia, IL 62236 and is currently estimated at $294,826, approximately $216 per square foot. 613 N Main St is a home located in Monroe County with nearby schools including Columbia Middle School, Columbia High School, and Gibault Catholic High School.
Ownership History
Date
Name
Owned For
Owner Type
Purchase Details
Closed on
Nov 18, 2021
Sold by
Lafata Daniel C and Lafata Dawn M
Bought by
Bault Enterprises Llc
Current Estimated Value
Home Financials for this Owner
Home Financials are based on the most recent Mortgage that was taken out on this home.
Original Mortgage
$217,600
Outstanding Balance
$193,706
Interest Rate
2.99%
Mortgage Type
New Conventional
Estimated Equity
$101,120
Purchase Details
Closed on
Nov 2, 2017
Sold by
Steele Donald P
Bought by
Lafata Daniel C and Lafata Dawn M
Home Financials for this Owner
Home Financials are based on the most recent Mortgage that was taken out on this home.
Original Mortgage
$255,000
Interest Rate
4.75%
Mortgage Type
Construction
Purchase Details
Closed on
Oct 31, 2014
Sold by
Donald Steele
Bought by
Lafata Dawn
Create a Home Valuation Report for This Property
The Home Valuation Report is an in-depth analysis detailing your home's value as well as a comparison with similar homes in the area
Home Values in the Area
Average Home Value in this Area
Purchase History
| Date | Buyer | Sale Price | Title Company |
|---|---|---|---|
| Bault Enterprises Llc | $272,000 | Columbia Title | |
| Lafata Daniel C | $220,000 | Monroe County Title Company | |
| Lafata Dawn | $222,000 | -- |
Source: Public Records
Mortgage History
| Date | Status | Borrower | Loan Amount |
|---|---|---|---|
| Open | Bault Enterprises Llc | $217,600 | |
| Previous Owner | Lafata Daniel C | $255,000 |
Source: Public Records
Tax History Compared to Growth
Tax History
| Year | Tax Paid | Tax Assessment Tax Assessment Total Assessment is a certain percentage of the fair market value that is determined by local assessors to be the total taxable value of land and additions on the property. | Land | Improvement |
|---|---|---|---|---|
| 2024 | $3,471 | $60,736 | $22,051 | $38,685 |
| 2023 | $3,787 | $61,900 | $21,410 | $40,490 |
| 2022 | $3,600 | $57,870 | $17,720 | $40,150 |
| 2021 | $3,323 | $53,880 | $13,700 | $40,180 |
| 2020 | $3,743 | $53,880 | $13,700 | $40,180 |
| 2019 | $3,550 | $50,970 | $13,700 | $37,270 |
| 2018 | $3,198 | $44,410 | $13,700 | $30,710 |
| 2017 | $3,174 | $45,210 | $13,947 | $31,263 |
| 2016 | $0 | $44,280 | $13,570 | $30,710 |
| 2015 | $2,889 | $40,170 | $14,890 | $25,280 |
| 2014 | $2,638 | $37,220 | $14,890 | $22,330 |
| 2012 | -- | $43,960 | $12,430 | $31,530 |
Source: Public Records
Map
Nearby Homes
- 817 N Briegel St
- 000 Young Or Divers
- 523 W Bottom Ave
- 209 Heritage St
- 127 S Rapp Ave
- 9700 Route 3
- 214 E Market St
- 3 Ogle Estates
- 212 S Columbia St
- 527 Fairfax Dr
- 6 Ogle Estates
- 1 Ogle Estates
- 208 W Washington St
- 3 Justin Dr
- 221 Tower Hill Dr
- 1 Meadowridge E
- 1374 Walnut Ridge Dr
- 1382 Walnut Ridge Dr
- 1379 Walnut Ridge Dr
- 1391 Walnut Ridge Dr
- 603 N Main St
- 625 N Main St
- 113 W Gundlach St
- 705 N Main St
- 632 N Main St
- 523 N Main St
- 713 N Main St
- 704 N Main St
- 517 N Main St
- 126 W Gundlach St
- 115 E Voges St
- 0 N Rapp Ave Unit MAR23043225
- 0 N Rapp Ave
- 116 Rueck St
- 719 N Main St
- 1 Jolene Acres
- 710 N Main St
- 623 N Metter Ave
- 631 N Metter Ave
- 518 N Rapp Ave