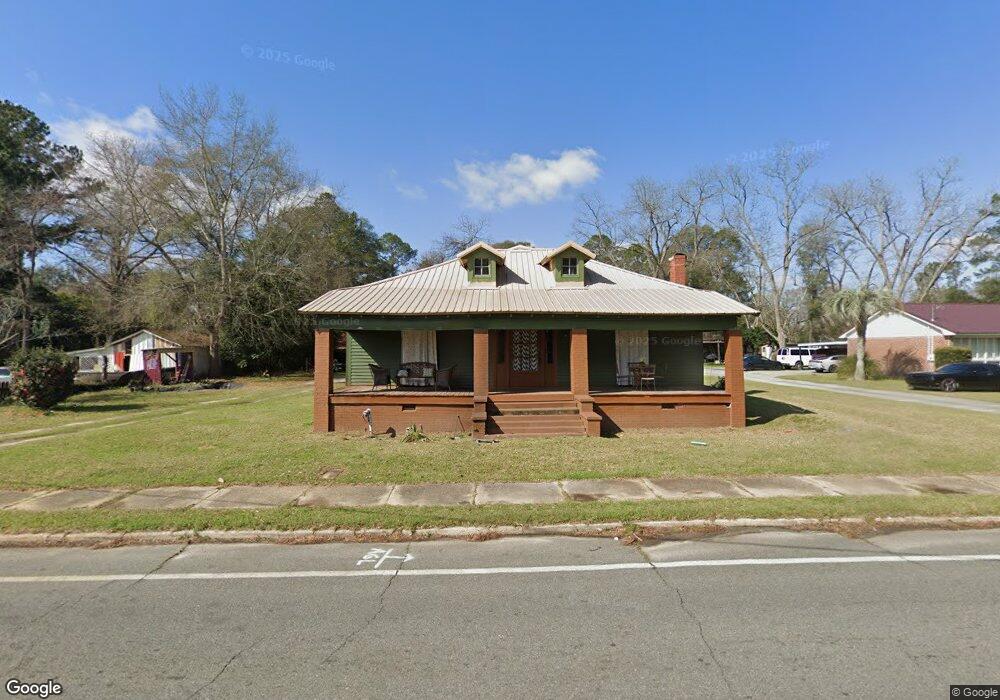
613 N Randolph St Oglethorpe, GA 31068
Estimated Value: $108,000 - $230,000
3
Beds
2
Baths
2,146
Sq Ft
$72/Sq Ft
Est. Value
About This Home
This home is located at 613 N Randolph St, Oglethorpe, GA 31068 and is currently estimated at $154,055, approximately $71 per square foot. 613 N Randolph St is a home with nearby schools including Macon County Elementary School, Macon County Middle School, and Macon County High School.
Ownership History
Date
Name
Owned For
Owner Type
Purchase Details
Closed on
Sep 9, 2014
Sold by
First State Bank
Bought by
Ivory Tracy and Ivory Lucrista
Current Estimated Value
Purchase Details
Closed on
Dec 2, 2004
Sold by
Howell William D
Bought by
Hart John and Melissa Harbuck
Purchase Details
Closed on
Nov 23, 2004
Sold by
Harbuck Melisa Yvone
Bought by
Howell William D
Purchase Details
Closed on
Jul 6, 2001
Sold by
Howell Danny
Bought by
Howell William D
Purchase Details
Closed on
Jul 5, 2001
Sold by
Columbus Bank &Trust
Bought by
Howell Danny
Purchase Details
Closed on
Jun 1, 2001
Sold by
Howell William D
Bought by
Harbuck Melisa Yvone
Purchase Details
Closed on
Mar 12, 2001
Sold by
Redfern Gary
Bought by
Columbus Bank &Trust
Purchase Details
Closed on
Oct 23, 2000
Sold by
Howell Josh
Bought by
Redfern Gary
Purchase Details
Closed on
Aug 13, 1999
Sold by
Adams Carl B
Bought by
Howell Danny
Purchase Details
Closed on
Mar 19, 1992
Sold by
Gardner Melva
Bought by
Adams Carl B
Create a Home Valuation Report for This Property
The Home Valuation Report is an in-depth analysis detailing your home's value as well as a comparison with similar homes in the area
Purchase History
| Date | Buyer | Sale Price | Title Company |
|---|---|---|---|
| Ivory Tracy | $45,000 | -- | |
| Hart John | $20,400 | -- | |
| Howell William D | -- | -- | |
| Howell William D | -- | -- | |
| Howell Danny | $15,000 | -- | |
| Harbuck Melisa Yvone | $25,000 | -- | |
| Columbus Bank &Trust | $29,000 | -- | |
| Redfern Gary | $29,000 | -- | |
| Howell Danny | $28,000 | -- | |
| Adams Carl B | $12,000 | -- |
Source: Public Records
Tax History
| Year | Tax Paid | Tax Assessment Tax Assessment Total Assessment is a certain percentage of the fair market value that is determined by local assessors to be the total taxable value of land and additions on the property. | Land | Improvement |
|---|---|---|---|---|
| 2025 | $1,624 | $42,845 | $2,185 | $40,660 |
| 2024 | $1,838 | $42,845 | $2,185 | $40,660 |
| 2023 | $1,838 | $42,845 | $2,185 | $40,660 |
| 2022 | $882 | $32,325 | $2,185 | $30,140 |
| 2021 | $1,067 | $24,785 | $2,185 | $22,600 |
| 2020 | $695 | $24,785 | $2,185 | $22,600 |
| 2019 | $1,027 | $23,849 | $2,185 | $21,664 |
| 2018 | $667 | $23,849 | $2,185 | $21,664 |
| 2017 | $667 | $23,849 | $2,185 | $21,664 |
| 2016 | $670 | $23,849 | $2,185 | $21,664 |
| 2015 | -- | $23,114 | $2,185 | $20,929 |
| 2014 | -- | $23,114 | $2,185 | $20,929 |
| 2013 | -- | $23,114 | $2,184 | $20,929 |
Source: Public Records
Map
Nearby Homes
- 204 Jordan St
- 502 Kaigler St
- 311 Macon St
- 310 Sumter St
- 1220 Georgia 49
- 432 Clifton Bradley Dr
- 503 S Dooly St
- 110 E Artesian Ave
- 100 Minor Ave
- 311 Overlook Dr
- 303 Christopher Cir
- 301 Christopher Cir
- 312 Christopher Cir
- 511 Forsyth St
- 311 Hillcrest Dr
- 313 Hillcrest Dr
- 0 Hillcrest Dr Unit 261714
- 505 Engram St
- 702 Overlook Dr
- 706 Overlook Dr
Your Personal Tour Guide
Ask me questions while you tour the home.